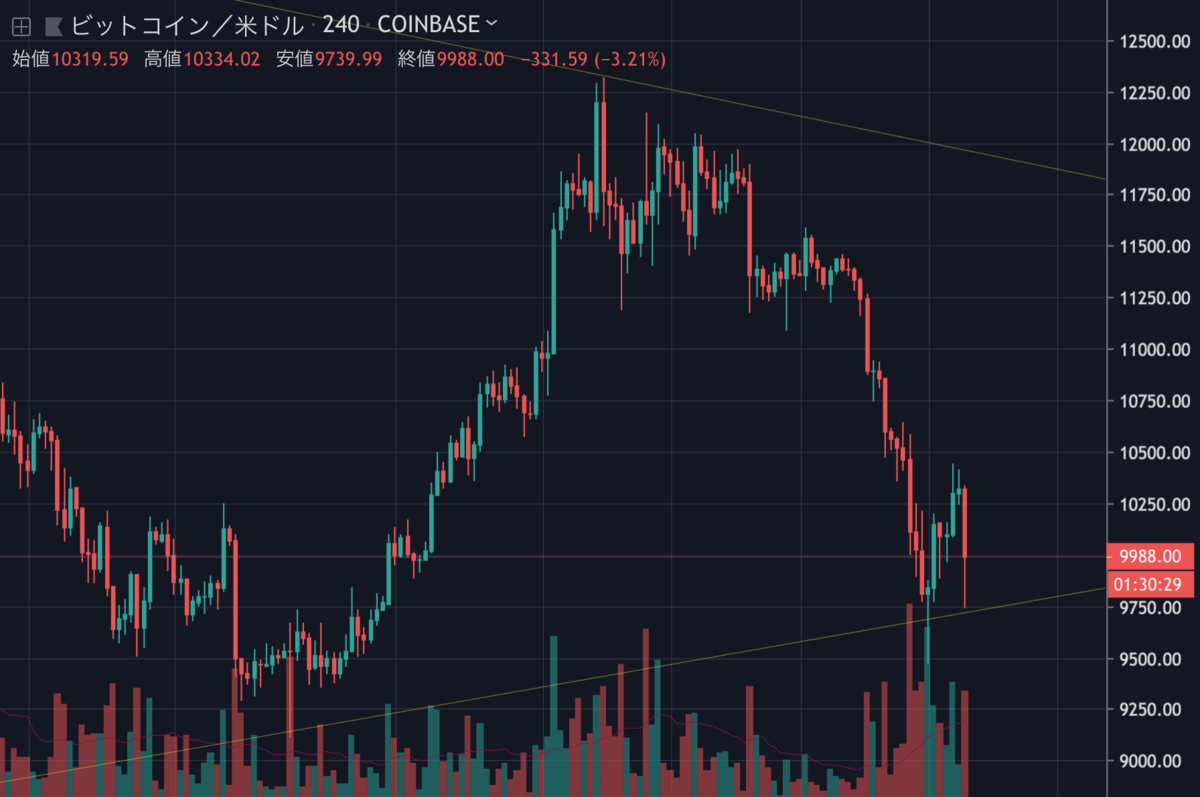
昨日のビットコインは10,000ドルを割り込み9,500ドル付近まで下落したものの、その後反発して10,000ドル台まで回復しました。記事執筆時点では10,000ドル付近で取引されています。

ビットコインの下落はまだ止まらないのでしょうか。NEWS BTCのチャート分析を見てみます。
ビットコインのチャート分析
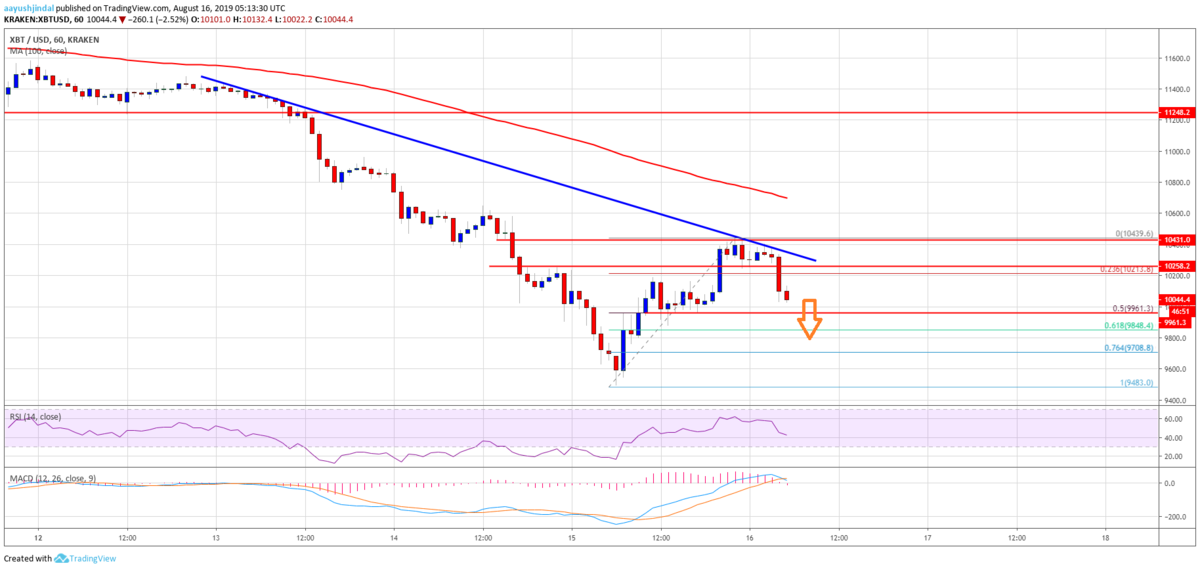
The next key support is near the $9,850 level. It represents the 61.8% Fib retracement level of the recent recovery from the $9,483 low to $10,439 high. If there is a downside break below the $9,850 support, bitcoin price is likely to resume its decline.
次の重要なサポートは9,850ドル付近。これは最近の回復(9,483ドル〜10,439ドル)の61.8% Fibリトレースメントレベルになります。もし9,850ドルのサポートを下抜ける場合は、再び下落に転じる可能性が高くなります。

On the upside, an immediate resistance is near the $10,250 level. Moreover, there is a major bearish trend line forming with resistance near $10,290 on the hourly chart of the BTC/USD pair. If there is an upside break above the trend line and the $10,400 resistance, the price could recover further in the near term.
上昇時の直近のレジスタンスは10,250ドル付近。さらに、BTC/USDペアの時間足チャートには、10,290ドル付近でレジスタンスとなる強い下降トレンドラインが形成されています。このトレンドラインと10,400ドルのレジスタンスを上抜けることができれば、価格は近いうちにさらに回復する可能性があります。
Looking at the chart, bitcoin price seems to be facing a strong resistance near the $10,300 and $10,400 levels. If it continues to struggle near $10,250 and $10,400, there are chances of more downsides below $10,000 and $9,850 in the coming sessions.
チャートを見ると、ビットコインの価格は10,300ドルと10,400ドル付近で強いレジスタンスに直面しているように見えます。引き続き10,250ドルと10,400ドル付近で停滞するようなら、今後は10,000ドルと9,850ドルを下抜けてさらに下落するでしょう。
via: Bitcoin (BTC) Price Recovery Could Fade, Fresh Decrease Likely
_


