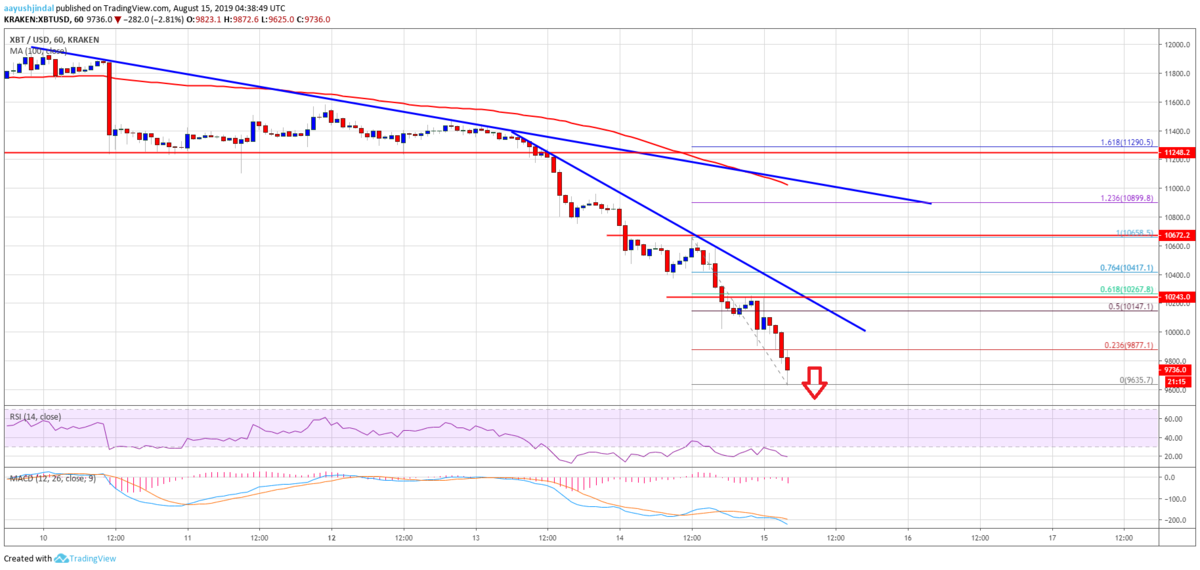
昨日のビットコインはサポートラインの10,000ドル付近まで急落しました。その後も下げ止まることはなく、記事執筆時点では9,500ドル前後で取引されています。
このまますべてのサポートをブレイクして下降トレンドに転換してしまうのでしょうか。NEWS BTCのチャート分析を見てみます。
(なるべく急ぎましたが、記事執筆中にもBTCがスルスルと下落しているため、後出しジャンケンのようになっています)
ビットコインのチャート分析
On the downside, the recent low at $9,635 is an immediate support. If there are more losses, the price could extend its decline towards the $9,500 support level. More importantly, the bears could target the $9,200 support area in the coming sessions.
下落時は最近の安値9,635ドルが直近のサポートになります。さらに下落すると、価格は9,500ドルのサポートに向かうでしょう。さらに重要なのは、弱気派の今後の目標が9,200ドルのサポートエリアになることです。

Looking at the chart, bitcoin price is placed in a strong downtrend below the $10,000 and $10,200 levels. If there is a weekly close below $10,000, the price could accelerate losses in the coming days. On the upside, a convincing follow through above $10,250 might set the pace for a recovery towards the $11,000 level.
チャートを見ると、ビットコインの価格は10,000ドルと10,200ドルを下回り強い下降トレンドにあります。もし週足が10,000ドル以下で引けると、数日中に下落が加速するでしょう。逆に10,250ドルを超えてしっかりと上昇すれば、11,000ドルに向けて回復する可能性があります。
via: Bitcoin (BTC) Price Final Target But Decline Far From Over
_


