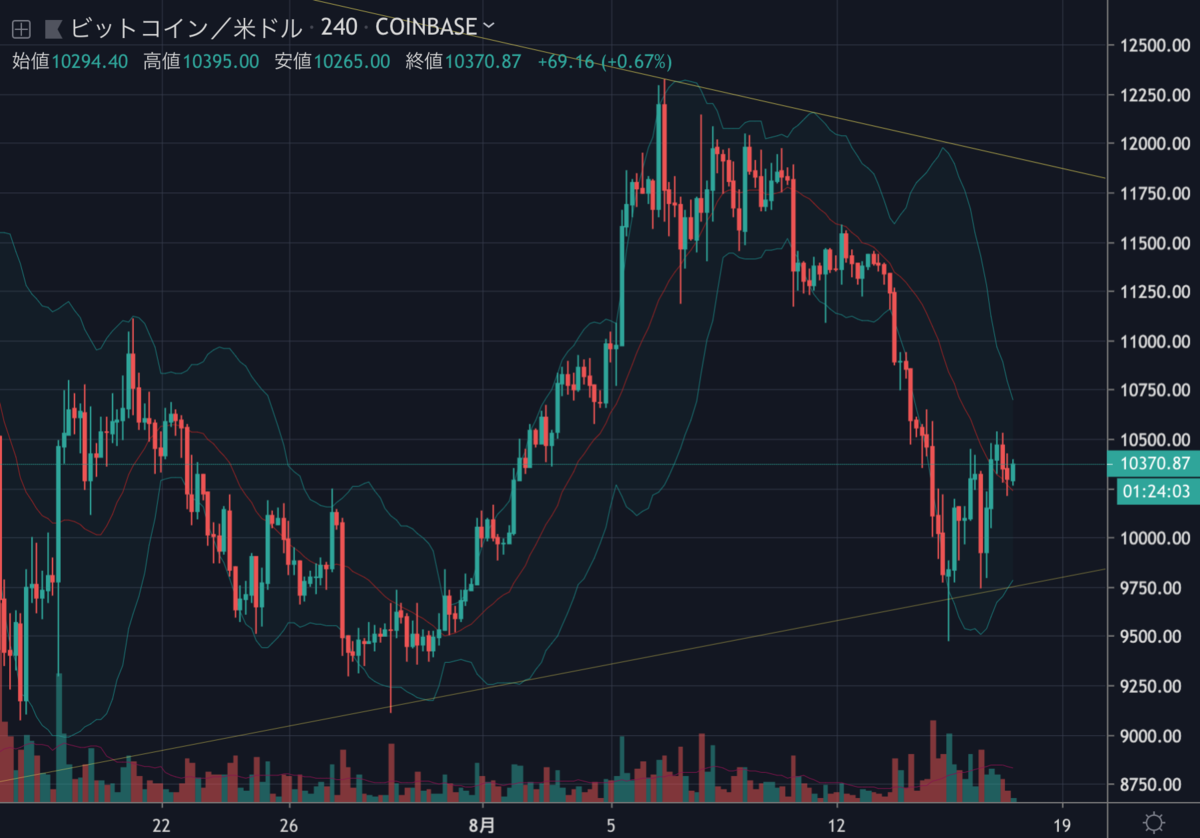
昨日のビットコインは10,000ドル前後を上下したものの、今日は少し上昇して5桁台で安定しています。記事執筆時点では10,300ドル付近で取引されています。

日本では盆休みがそろそろ終わりますが、相場に資金は戻ってくるのでしょうか。NEWS BTCのチャート分析を見てみます。
ビットコインのチャート分析
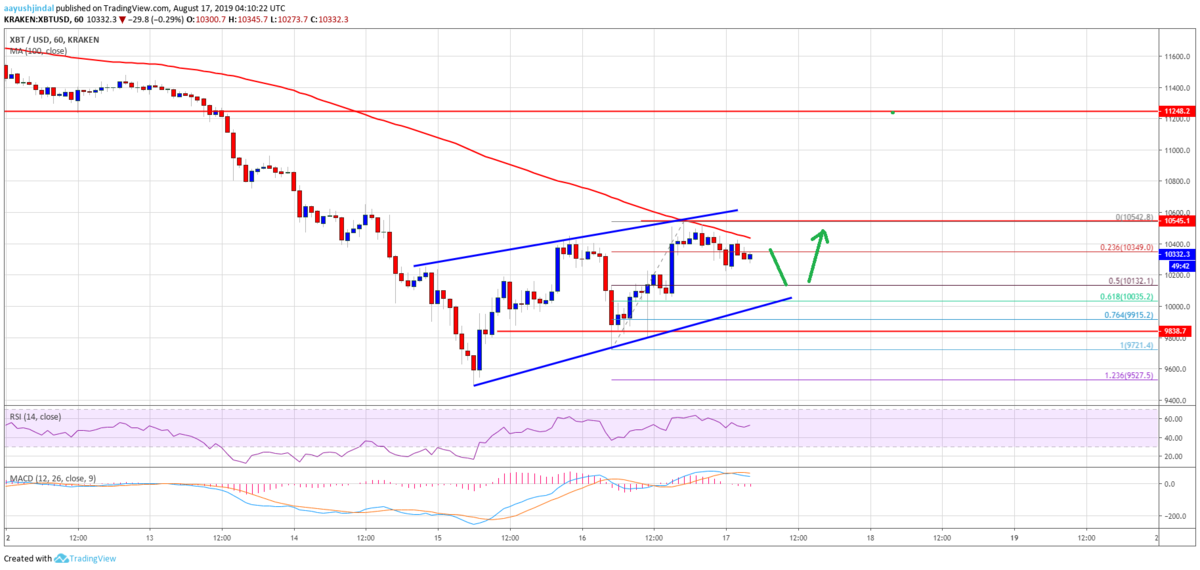
An immediate support on the downside is near the $10,130 level. It represents the 50% Fib retracement level of the recent wave from the $9,721 low to $10,542 high. However, the main supports are near the $10,000 and $9,950 levels. Additionally, the 61.8% Fib retracement level of the recent wave from the $9,721 low to $10,542 high will most likely act as a support near $10,035.
下落時の直近のサポートは10,130ドル付近。これは、最近の波(9,721ドル〜10,542ドル)の50% Fibリトレースメントレベルになります。しかし、主なサポートは10,000ドルと9,950ドル付近。さらに、最近の波(9,721ドル〜10,542ドル)の61.8% Fibリトレースメントレベルが、10,035ドル付近でサポートとして機能する可能性が高いでしょう。

On the upside, the price must gain momentum above the $10,400 and $10,500 resistance levels. Moreover, a successful close above the 100 hourly SMA could start a strong rise towards the $10,600 and $10,800 levels. Conversely, if the price starts a fresh decline and breaks the $10,000 support, the next key support is near the $9,800 level.
上昇する場合は、レジスタンスの10,400ドルと10,500ドルを上回る勢いが必要になります。さらに、100時間SMA(単純移動平均線)以上で引けると、10,600ドルと10,800ドルに向けて力強い上昇が始まる可能性があります。逆に、価格が再び下落を始め、10,000ドルのサポートを下抜けると、次の重要なサポートは9,800ドル付近になります。
Looking at the chart, bitcoin price is clearly showing a few positive signs above the $10,000 level. Having said that, the bulls need to gain momentum above the 100 hourly SMA and $10,450 to push the price further higher in the near term.
チャートを見ると、ビットコインの価格は明らかに1万ドル以上でいくつかのポジティブサインを示しています。しかし、短期的に価格をさらに上昇させるには、100時間SMAと10,450ドルを上回る勢いが必要になります。
via: Bitcoin (BTC) Price Hesitates But Further Recovery Seem Likely
_


