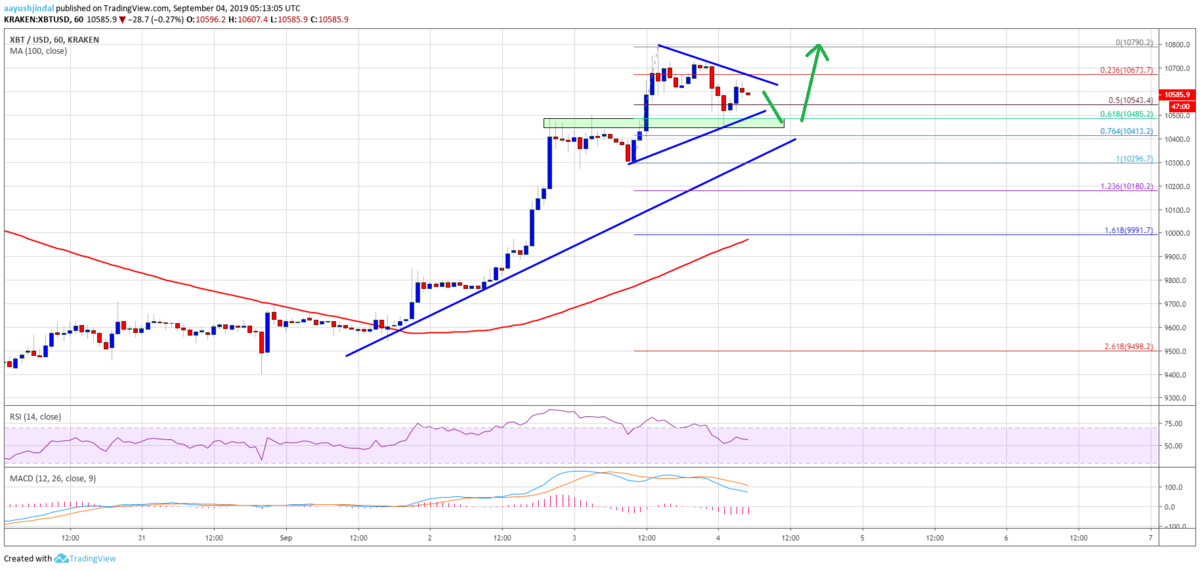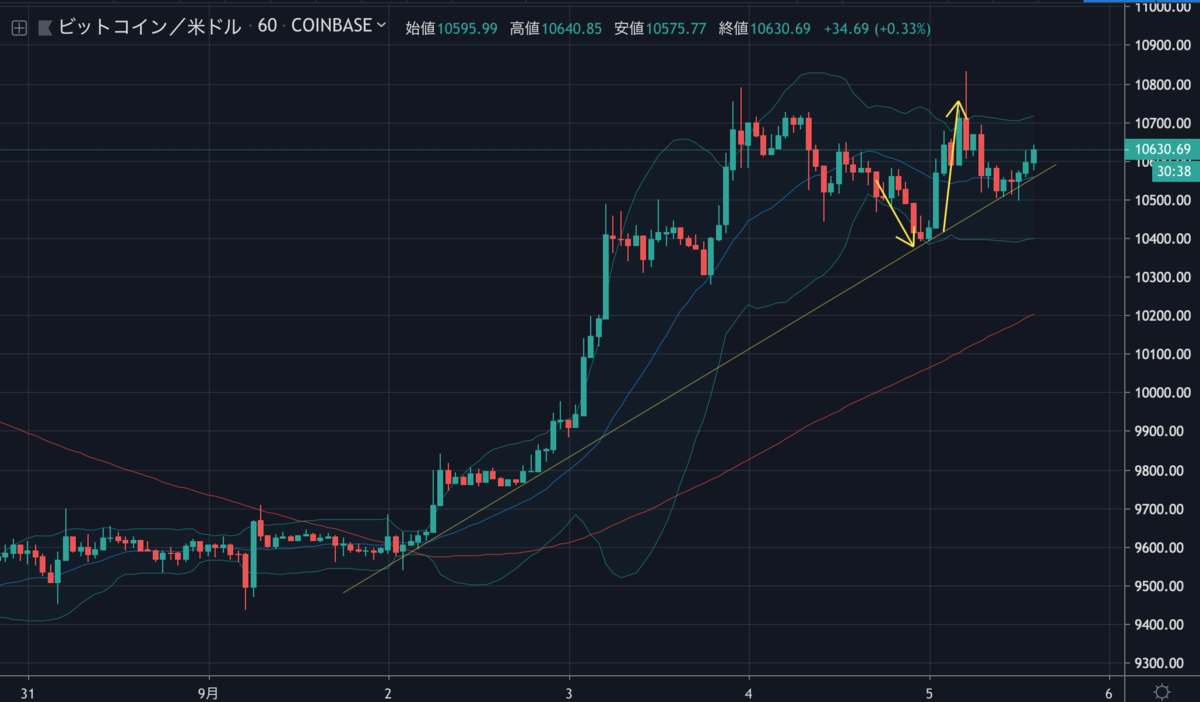
ビットコインの価格は上昇トレンドラインでサポートされ、昨日のNEWS BTCの予想図と寸分違わぬ軌道で反発しました。

Bitcoin Price (BTC) Surging, Dips Remains Well Supported

完璧主義か。
この反発でビットコインは今月の高値を更新し、10,800ドル以上まで上昇しました。その後は価格を戻し、現在は引き続きトレンドラインにサポートされながら10,600ドル付近で取引されています。
今日もNEWS BTCのチャート分析を見てみます。
ビットコインのチャート分析
Yesterday, we saw strong gains in BTC above the $10,500 resistance area against the US Dollar.
昨日、BTCは対ドルで10,500ドルのレジスタンスエリアを大きく超えて上昇しました。

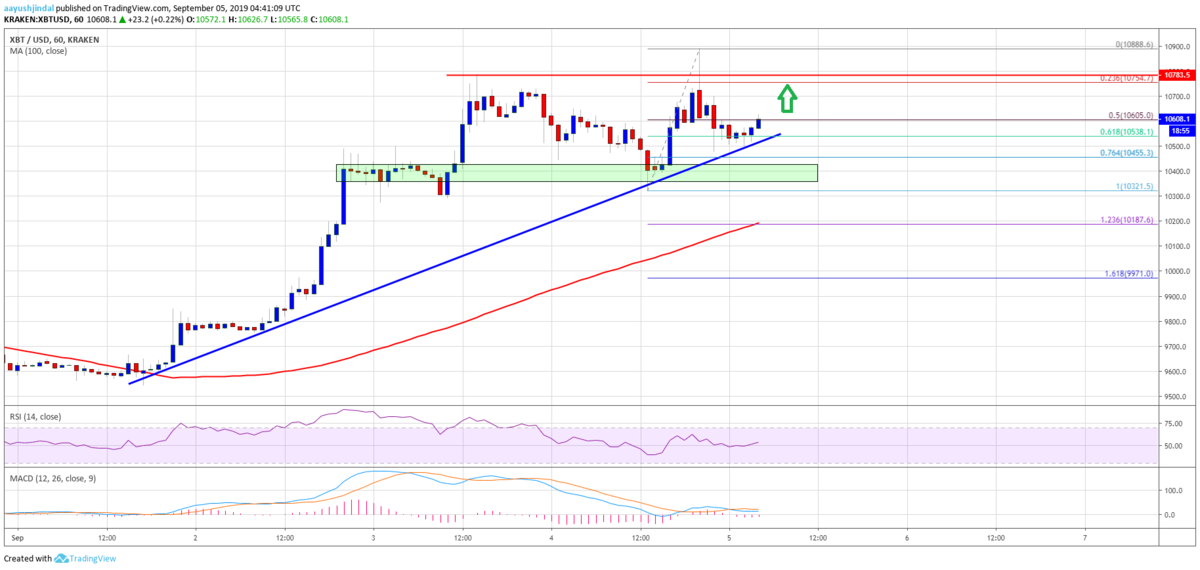
A new monthly high was formed near $10,888 and recently the price corrected lower.
10,888ドル付近で月間の新高値を付けた後、下落に転じました。
However, the decline was protected by the $10,500 support area. Additionally, yesterday’s highlighted key bullish trend line is providing support near $10,510 on the hourly chart of the BTC/USD pair.
しかし、下落は10,500ドルのサポートエリアで防がれました。さらに、昨日注目した重要な上昇トレンドラインが、BTC/USDペアの時間足チャートの10,510ドル付近でサポートになっています。
On the upside, an immediate resistance is near the $10,700 and $10,800 levels. If there is a successful close above $10,800, the price is likely to accelerate higher above the $10,880 and $10,900 levels. The next key resistance is near the $11,000 level. If there are more gains, the price could test the $11,200 resistance area.
上昇する場合の直近のレジスタンスは10,700ドルと10,800ドル付近になります。10,800ドル以上で引けると、価格は10,880ドルと10,900ドルを超えて上昇を加速させる可能性が高いでしょう。次の重要なレジスタンスは11,000ドル付近になります。さらに上昇すれば、11,200ドルのレジスタンスエリアを試す可能性があります。
Conversely, if the price fails to break the $10,700 and $10,800 resistance levels, it could correct lower. An initial support is near the $10,500 level. However, the main support is near the $10,400 level, below which the price could extend its decline towards the $10,200 support and the 100 hourly SMA.
逆に10,700ドルと10,800ドルのレジスタンスを突破できなければ下落する可能性があります。最初のサポートは10,500ドル付近ですが、主なサポートは10,400ドル付近になります。これを下抜けると、10,200ドルのサポートと100時間SMA(単純移動平均線)に向けて価格が下落する可能性があります。
via: Bitcoin Price (BTC) Hesitates But Further Gains Seem Likely
_


