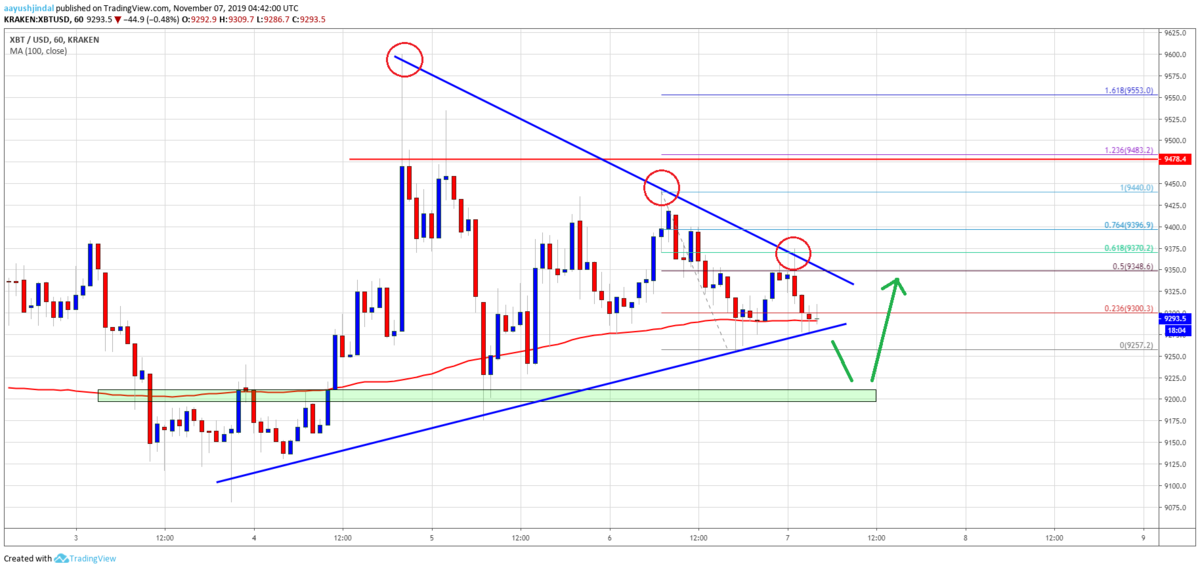
ここ数日のビットコインは三角持ち合いを形成しており、そろそろブレイクアウトしてどちらかに動き出しそうな状況になっています。
記事執筆時点では9,300ドル付近で取引されていますが、今後の値動きはどのように予想されるのでしょうか。
NEWS BTCでビットコインのチャート分析を見てみます。
ビットコインのチャート分析
An immediate resistance on the upside is near the $9,350-$9,360 area. It coincides with the 50% Fib retracement level of the recent drop from the $9,440 high to $9,257 low.
直近のレジスタンスは、9,350ドル〜9,360ドル付近です。これは、最近の下落(9,440ドル〜9,257ドル)の50% Fibリトレースメントレベルと一致します。

Moreover, there is a key contracting triangle pattern forming with resistance near $9,360 on the hourly chart of the BTC/USD pair. Therefore, an upside break above the $9,360 and $9,400 resistance levels could set the pace for more gains in the near term.
さらに、BTC/USDペアの時間足チャートには、9,360ドル付近でレジスタンスとなる重要な三角持ち合いが形成されています。そのため、9,360ドルと9,400ドルのレジスタンスを突破すれば、短期的にさらに上昇する可能性があります。
On the downside, an immediate support is near the triangle trend line at $9,270. If there is a downside break below the triangle and the 100 hourly SMA, the price could test the main $9,200 support area.
下落時の直近のサポートは9,270ドルのトライアングルトレンドライン付近。このトライアングルと100時間SMAを下抜けると、価格は9,200ドルのメインサポートエリアを試すでしょう。
Looking at the chart, bitcoin is clearly trading inside a breakout pattern with resistance near $9,350-$9,400. A successful close above $9,400 is needed for more upsides. If not, there is a risk of a bearish reaction below the $9,200 support.
チャートを見ると、ビットコインは明らかにブレイクアウトパターンの内側で取引されており、9,350から9,400ドルがレジスタンスになっています。ここから上昇するには、9,400ドル以上で引ける必要があります。それができなければ、弱気の反応で9,200ドルを下抜ける恐れがあります。
via: Bitcoin (BTC) Price Positioning For Breakout or Further Decline?
_


