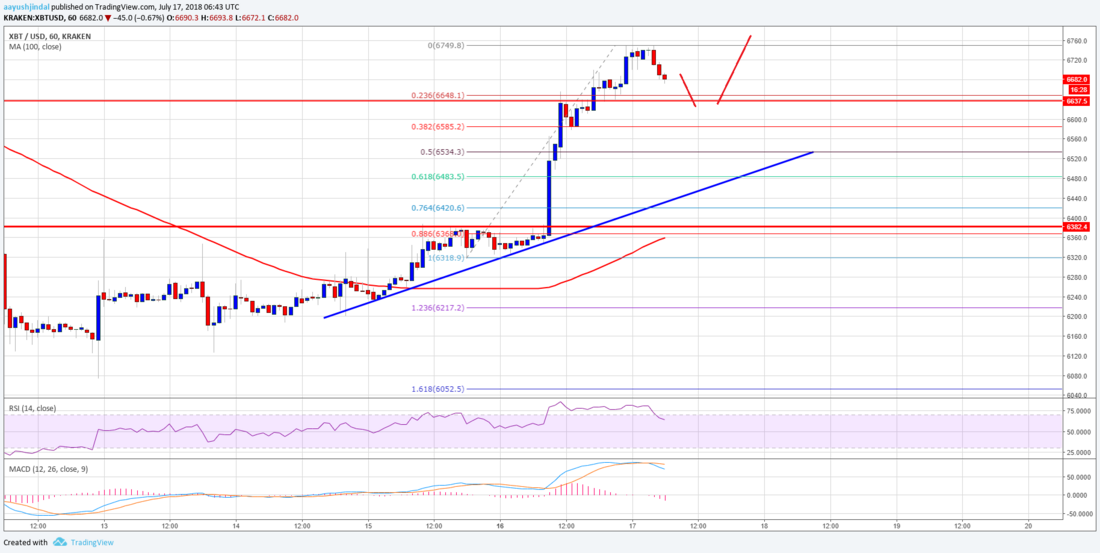
昨日ビットコイン価格が大きく上昇しましたが、その後もさらに上昇を続けています。ビットコインのチャート分析を見てみます。
仮想通貨の英語記事シリーズ、今回はこの記事を読んでいきます。
Bitcoin Price Watch: BTC/USD’s Trend Overwhelmingly Bullish
ビットコインのチャート分析
Bitcoin price settled above a key barrier at $6,300 against the US Dollar. It opened the doors for more gains and the BTC/USD pair surged above the $6,380 and $6,600 resistance levels.
ビットコイン価格は 6,300 ドルの重要な壁を超えて落ち着きました。これによりさらに上昇する可能性が生まれ、BTC/USD ペアは 6,380 ドルと 6,600 ドルのレジスタンスレベルを突破しました。

The upside move was such that the price even broke the $6,700 resistance. A high was formed at $6,749 and the price is currently correcting lower. On the downside, there are many supports starting with the $6,650 level.
この上昇は 6,700 ドルのレジスタンスさえ超えるほどでした。価格は 6,749 ドルで高値を付け、現在は調整で下落しています。下側には、6,650 ドルレベルから始まる多くのサポートがあります。
The 23.6% Fib retracement level of the last wave from the $6,318 low to $6,749 high is positioned at $6,648 and is likely to hold declines. Should there be a break below $6,648, the price may perhaps trade towards the $6,600 support.
最後の波 (6,318〜6,749 ドル) の 23.6% フィボナッチリトレースメントレベルは 6,648 ドルに位置し、下降を防ぐ可能性があります。6,648 ドルを下抜ければ、価格はおそらく 6,600 ドルのサポートに向かうでしょう。
Looking at the chart, the price clearly settled above $6,600 and the 100 hourly simple moving average. On the upside, a break above the $6,750 high could set the path for a move towards $7,000.
チャートを見ると、価格は明らかに 6,600 ドルと 100 時間移動平均線以上で安定しています。6,750 ドルの高値を上抜ければ、7,000 ドルに向けて上昇する可能性があります。
_


