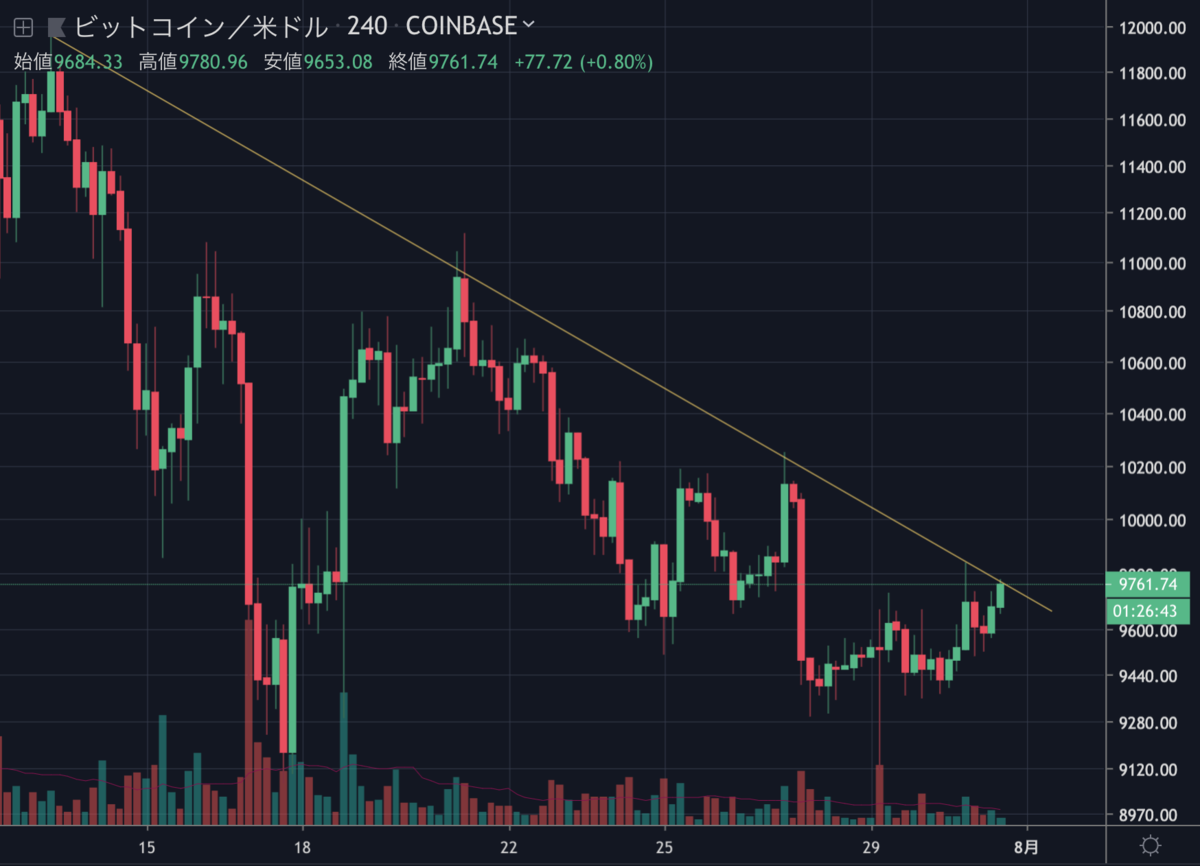
ビットコインは昨日からゆっくりと上昇を続け、現在は9,700ドル付近を推移しています。
チャートでは三角保ち合いを形成し、レジスタンス(抵抗線)を突破できるかどうかという状況です。NEWS BTCのチャート分析を見てみます。

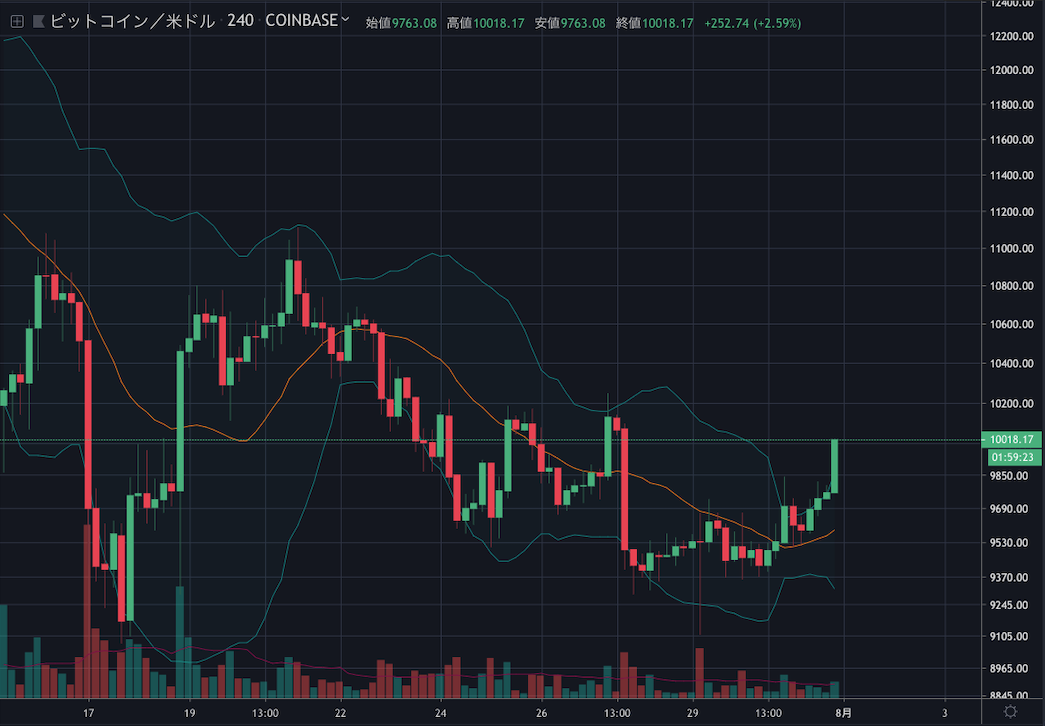
[23:00 追記]
1万ドルを突破しました。

ビットコインのチャート分析
The next immediate resistance is near the $9,940 level, above which the price is likely to surpass $10,000. The main resistance on the upside is near the $10,200 level. Conversely, if there is a downside break below the $9,525 support and the 100 hourly SMA, the price could retest the $9,200 support area.
次のレジスタンスは9,940ドル付近、これを上抜ければ1万ドルを超える可能性が高くなります。上昇時の主なレジスタンスは10,200ドル付近になります。逆に、9,525ドルのサポートと100時間SMA(単純移動平均線)を下抜けた場合、価格は9,200ドルのサポートエリアを再び試す可能性があります。
In the past few hours, bitcoin price recovered above $9,500 against the US Dollar. BTC price is showing positive signs and it could continue to rise towards $10,000 and $10,200.
ここ数時間で、ビットコインの価格は対ドルで9,500ドルを超えるまで回復しました。BTCの価格はポジティブな兆候を示し、10,000ドルと10,200ドルに向けて上昇を続ける可能性があります。
However, the bulls might struggle to clear the $9,770 and $9,800 level. If they succeed, the price could revisit the $10,200 resistance.
しかし、買い方は9,770ドルと9,800ドルの水準を突破するのに苦労するかもしれません。もし成功すれば、価格は再び10,200ドルのレジスタンスに届く可能性があります。
via: Bitcoin Price (BTC/USD) Signaling Bullish Continuation To $10,200
_


