こんばんは。ちょっと眠いですが寝る前にビットコインのチャート分析を見てみます。
仮想通貨の英語記事シリーズ、今回はこの記事を読んでいきます。
Bitcoin Price Weekly Analysis – BTC/USD Could Break $10,000
ビットコインのチャート分析

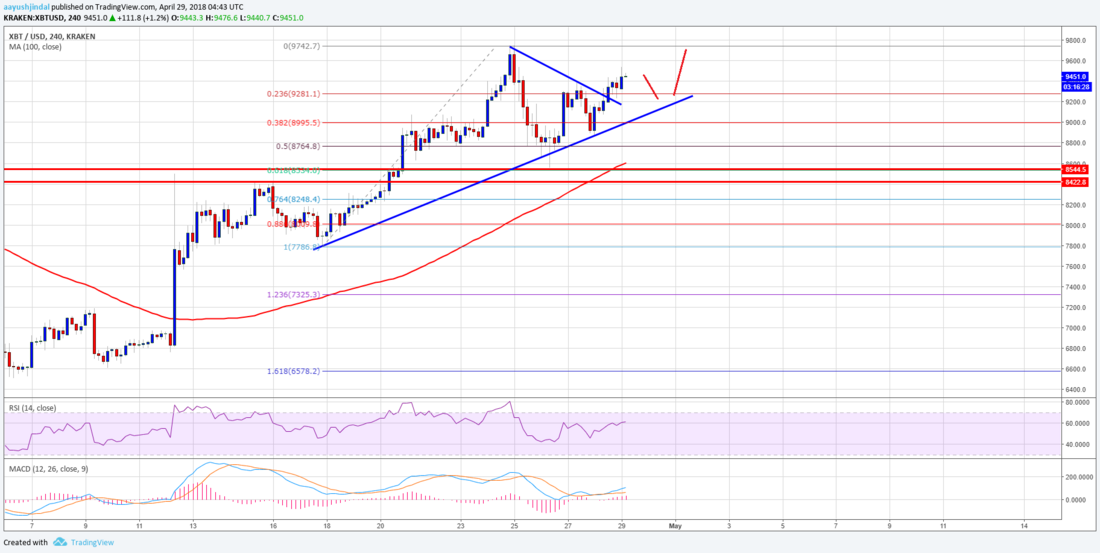
BTC price tested the 61.8% Fib retracement level of the last leg from the $7,786 low to $9,742 high to complete a correction pattern. It started an upside move and moved back above $9,000. Buyers also succeeded in breaking a connecting bearish trend line with resistance at $9,200 on the 4-hours chart of the BTC/USD pair.
BTC の価格は、7,786 ドルの安値から 9,742 ドルの高値で作られる最後の足の 61.8% フィボナッチリトレースメント水準を試し、反発パターンを完成させました。ここから上昇の動きが始まり、9,000 ドル以上まで回復しました。また、買い方は BTC/USD ペアの 4 時間足チャートにおいて 9,200 ドルで抵抗になる下降トレンドラインの突破に成功しました。
It seems like the pair is back in an uptrend above $9,200, and it could accelerate gains towards $9,750. More importantly, the price may perhaps break the all-important $10,000 level to trade to a new monthly high.
同通貨ペアは 9,200 ドル以上で上昇トレンドに戻ったようで、9,750 ドルを目指してさらに上昇が加速する可能性があります。さらに重要なことに、価格は非常に重要な 10,000 ドル水準を突破し、一ヶ月の新高値を更新する可能性もあります。
Looking at the chart, there is a key bullish trend line in place with support at $9,150. Therefore, if the price corrects lower from the current levels, then $9,200, $9.150 and $9,000 levels are likely to prevent declines.
チャートを見ると、9,150 ドル付近でサポートされる重要な上昇トレンドラインがあります。そのため、価格が現在の水準から下がる場合は、9,200 ドル、9,150 ドル、9,000 ドル水準が下落を支えることになりそうです。
_


