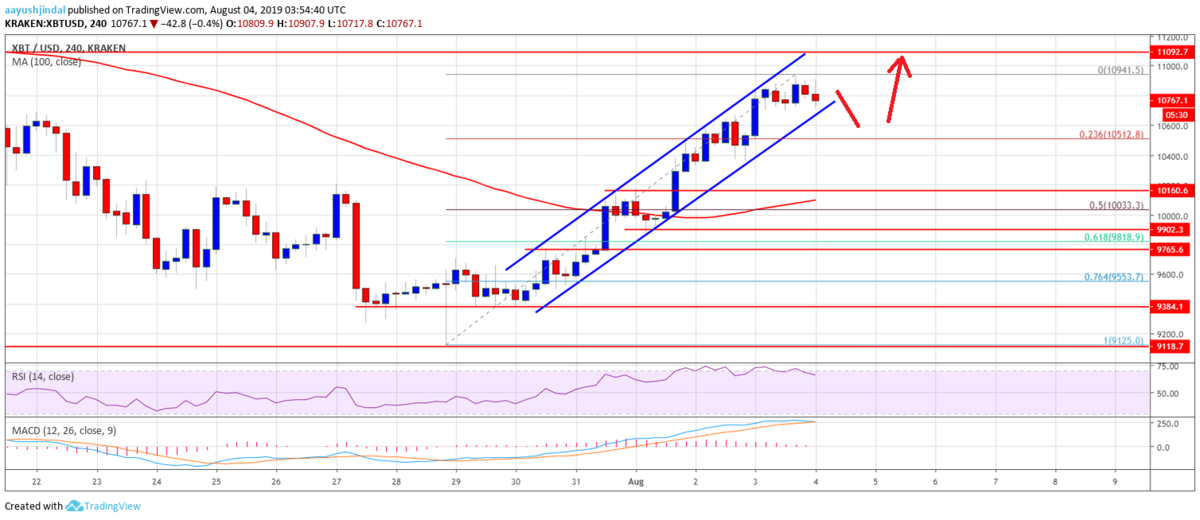
ビットコインは10,600ドルを超え、一時的に10,900ドルまで上昇しました。現在は調整して10,700ドル付近で取引されています。
連日上昇を続けているためそろそろ大きく下落しそうな気もしますが、今後の値動きはどうなるのでしょうか。最近やたらと当たっているNEWS BTCのチャート分析を見てみます。
[8/5 0:30 追記]
現在のチャートが予想図と完全に一致すぎてちょっと引くレベル。
この人の予想神ってるな・・・・・・。

[8/5 1:00 追記]
11,000ドルを突破。

[8/5 10:00 追記]
11,200ドルを突破。どんどん上がる。

ビットコインのチャート分析
The next major support is near the $10,200 and $10,000 support levels. The 50% Fib retracement level of the last upward move from the $9,125 low to $10,941 high is also likely to act as a support. Moreover, the 100 SMA is also near the $10,050 level, which is likely to act as a strong support. On the upside, there is a key resistance near the $11,000 level.
次の大きなサポートは10,200ドルと10,000ドル付近になります。最近の上昇(9,125ドル〜10,941ドル)の50% Fibリトレースメントレベルもサポートとして機能するでしょう。また、100SMA(単純移動平均線)も10,050ドル付近に位置しており、強力なサポートとして機能する可能性が高くなります。上昇時は11,000ドル付近に重要なレジスタンスがあります。

If there is an upside break above the $11,000 level, there are chances of more gains. If there is a successful close above the $11,000 resistance, the next stop for the bulls could be near the $11,200 level. Overall, any further upsides will most likely push the price towards the $11,500 and $11,650 levels.
11,000ドルを上抜ければ、さらに価格を伸ばす可能性があります。11,000ドルのレジスタンス以上で引ければ、次の抵抗線は11,200ドル付近になるでしょう。全体的に見て、さらに価格が上昇する場合は、11,500ドルと11,650ドル付近まで目指す可能性が高くなります。
Looking at the chart, bitcoin price is showing a lot of positive signs above the $10,200 support and the 100 SMA. Therefore, as long as the price is above the $10,200 pivot level, the price is likely to continue higher and the bulls might aim $11.2K or $11.5K.
チャートを見ると、ビットコインの価格は10,200ドルのサポートと100SMA以上で多くのポジティブサインを示しています。そのため、価格が10,200ドルのピボットレベルを上回っている限り、価格は11,200ドルと11,500ドルへ向けて上昇を続ける可能性があります。
via: Bitcoin (BTC) Price Weekly Forecast: Can Bulls Aim $11.5K?
_


