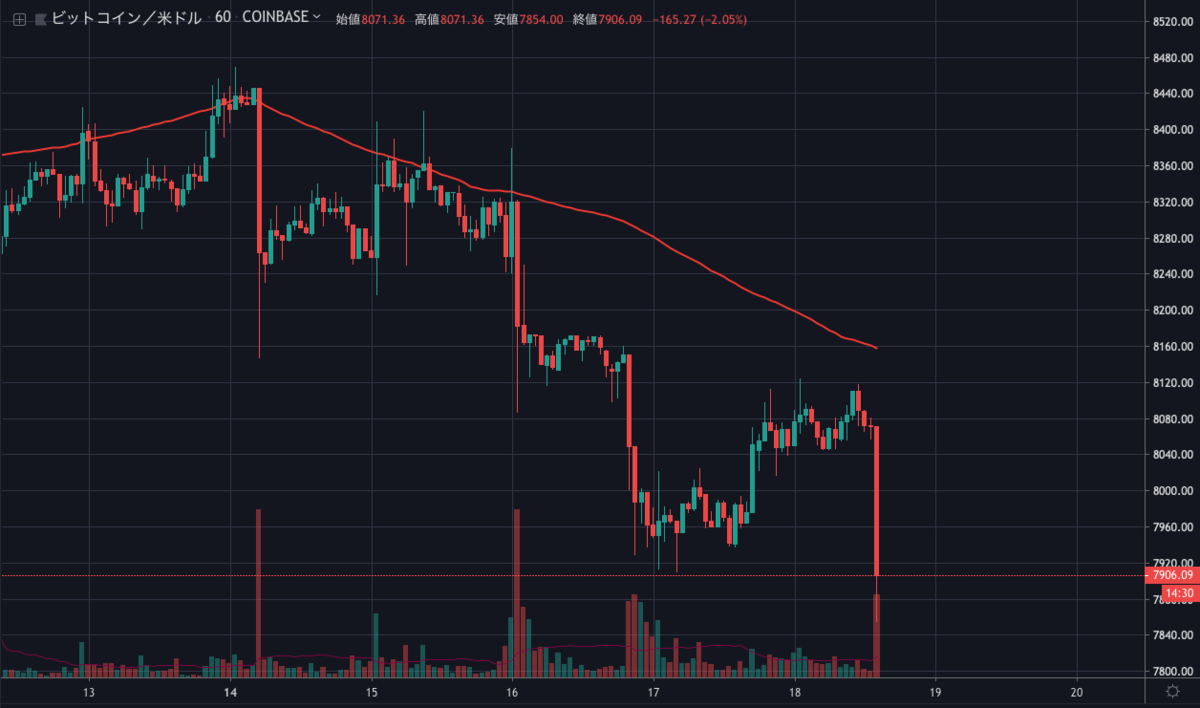
昨日わずかに反発したビットコインは本日の14時台に再び急落しました。記事執筆時点では7900ドル前後で取引されています。
ちょっと前からショートしている身としては昨日の上昇で少し焦ったものの、とりあえず持ち直したようです(今は)。

Bitcoin (BTC) Price Bearish Breakdown Looks Real, $7,500 Next?

10月に入ってから大きな動きを見せないビットコインですが、今後の値動きはどのように予想されるのでしょうか。
NEWS BTCのチャート分析を見てみます。
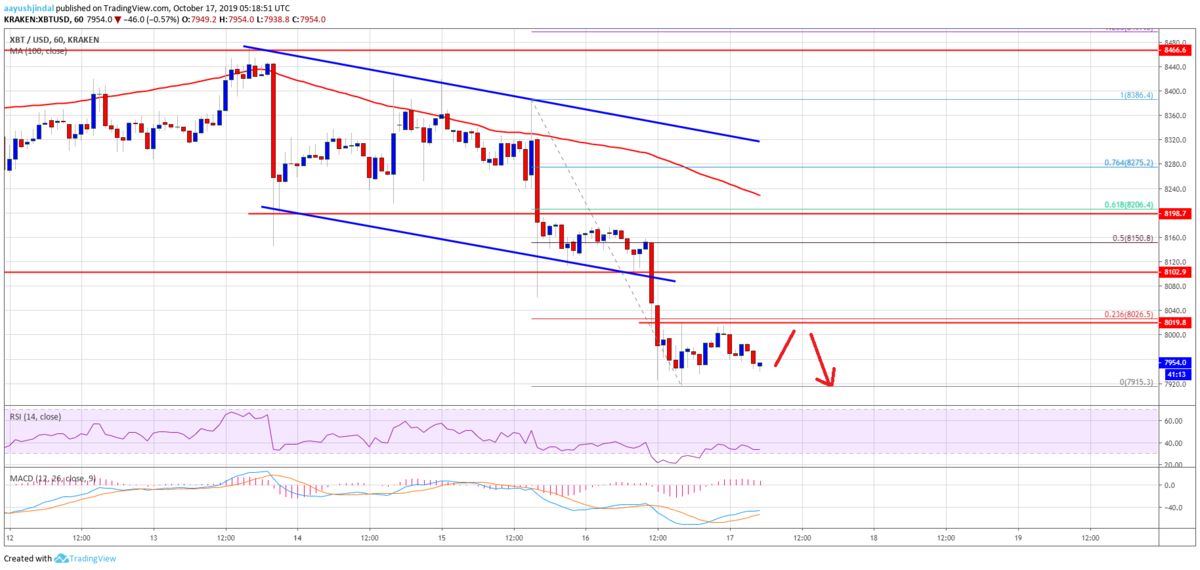
ビットコインのチャート分析
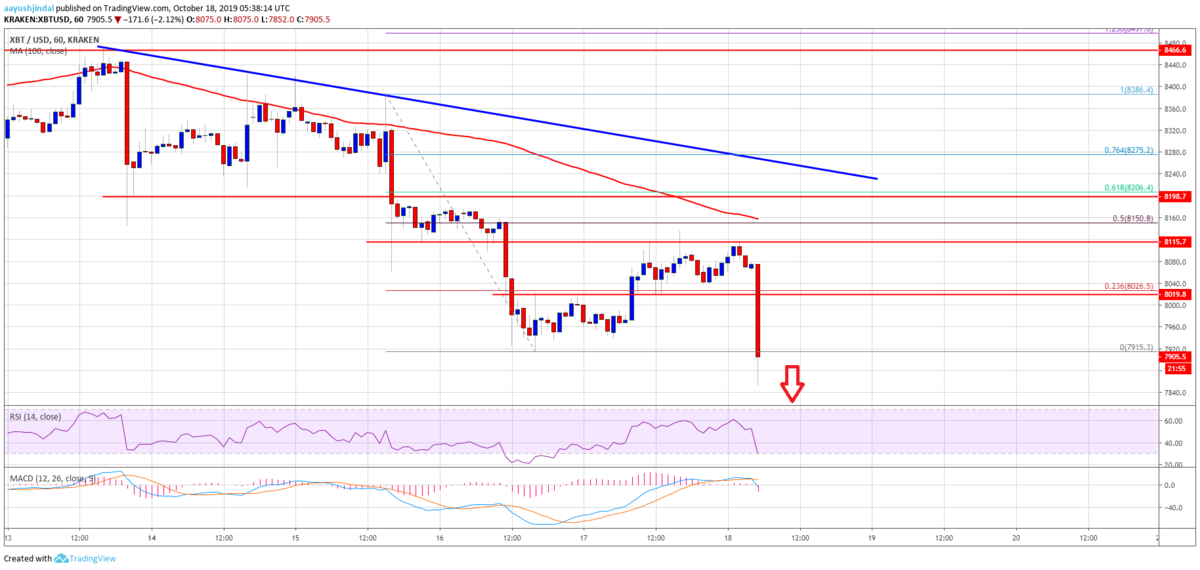
It seems like there was a strong bearish reaction below $8,000. The next key support is near the $7,800 level. If there are more downsides, bitcoin price could accelerate losses towards the $7,600 and $7,500 levels in the near term. An intermediate support is near the $7,720 level.
8,000ドル以下で弱気の強い反応があったようです。次の重要なサポートは7,800ドル付近。さらに下落すると、短期的には7,600ドルと7,500ドル台に向けてさらに下落が加速する可能性があります。中間サポートは7,720ドル付近です。

On the upside, the $8,000 and $8,020 levels are likely to act as hurdles for the bulls. The main resistance is near the $8,120 level and the 100 hourly simple moving average. Besides, there is a major bearish trend line forming with resistance near $8,240 on the hourly chart of the BTC/USD pair.
上昇する場合は、8,000ドルと8,020ドル付近が買い方にとってハードルとして機能するでしょう。メインレジスタンスは、8,120ドルと100時間SMA(単純移動平均線)付近です。さらに、BTC/USDペアの時間足チャートで、8,240ドル付近でレジスタンスとなる大きな下降トレンドラインが形成されています。
Looking at the chart, bitcoin is clearly under a lot of pressure below $8,120 and $8,000. As long as there is no close above $8,120 and $8,240, there are chances of more downsides. The main target for the bearish in the coming sessions could be near the $7,600 and $7,500 levels.
チャートを見ると、ビットコインは明らかに8,120ドルと8,000ドル以下で多くの圧力にさらされています。8,120ドルと8,240ドルを超えて引けない限り、さらに下落する可能性が高くなります。売り方の今後のメインターゲットは、7,600ドルと7,500ドル付近になるでしょう。
via: Bitcoin (BTC) Price Accelerating Losses Below $8K, $7.5K Very Likely
_


