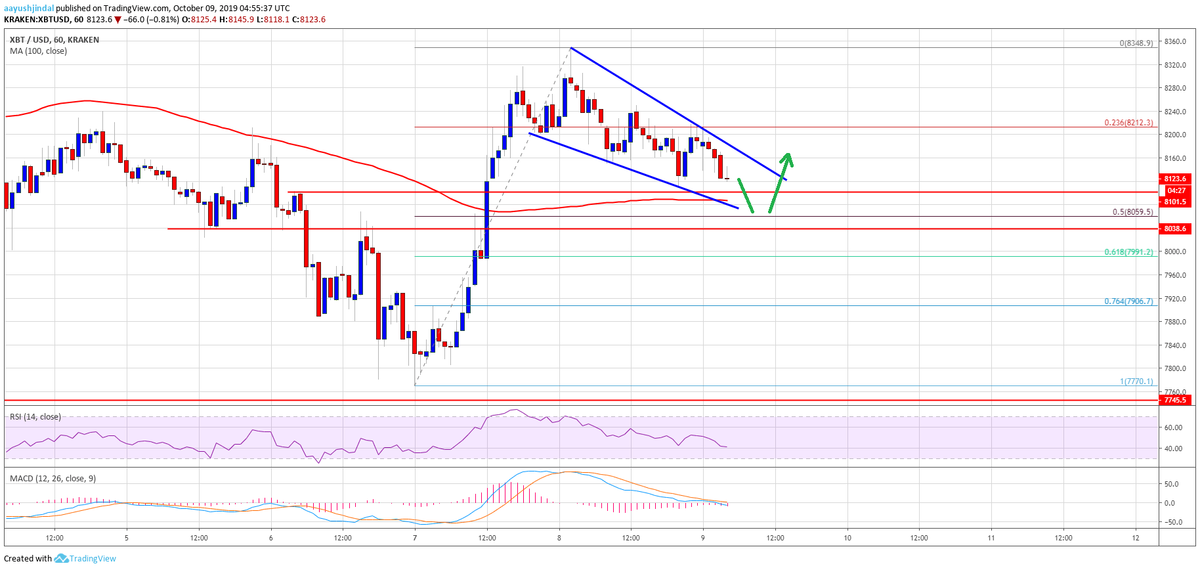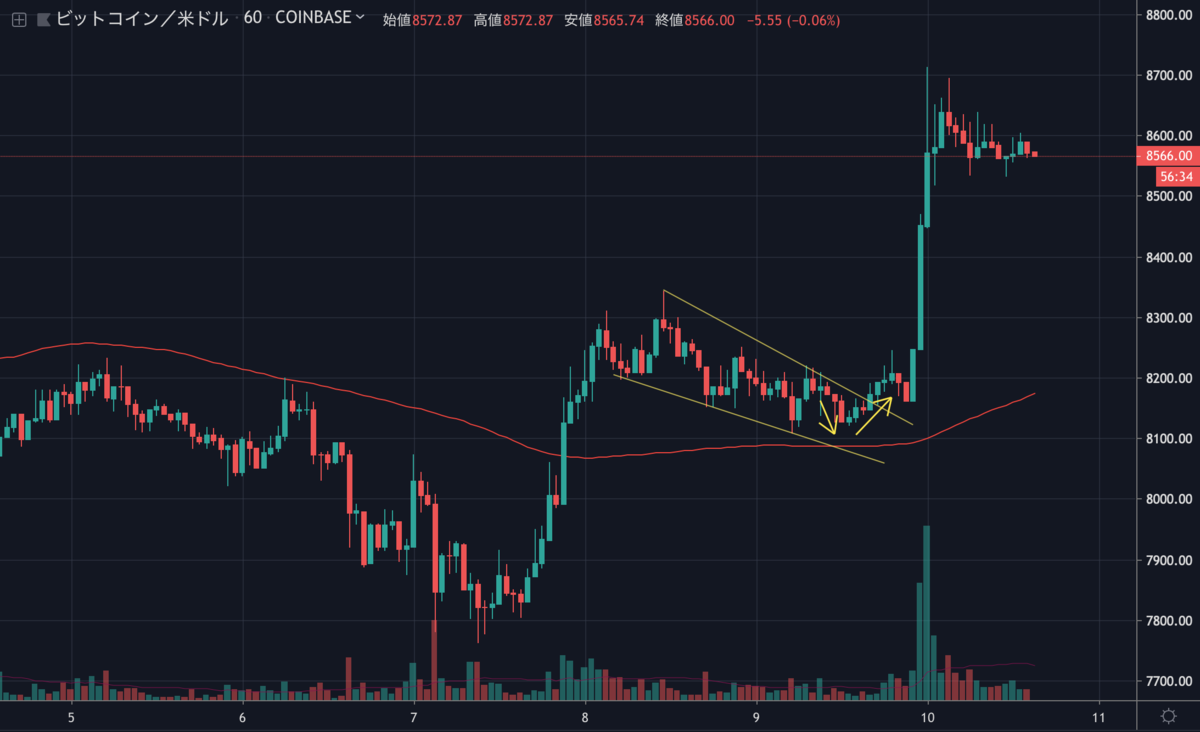
昨日のビットコインは、レジスタンスとなっていた下降トレンドラインを上抜け急騰し、8,500ドル台に到達しました。
NEWS BTC先生の昨日の予想もほぼ的中し、期待以上に高騰しました。

Bitcoin Price (BTC) Holding $8K and Likely To Bounce Back

急騰後も大きく下落することなく8,500ドル台を維持していますが、今後の値動きはどのように予想されるのでしょうか。
NEWS BTCのチャート分析を見てみます。
ビットコインのチャート分析
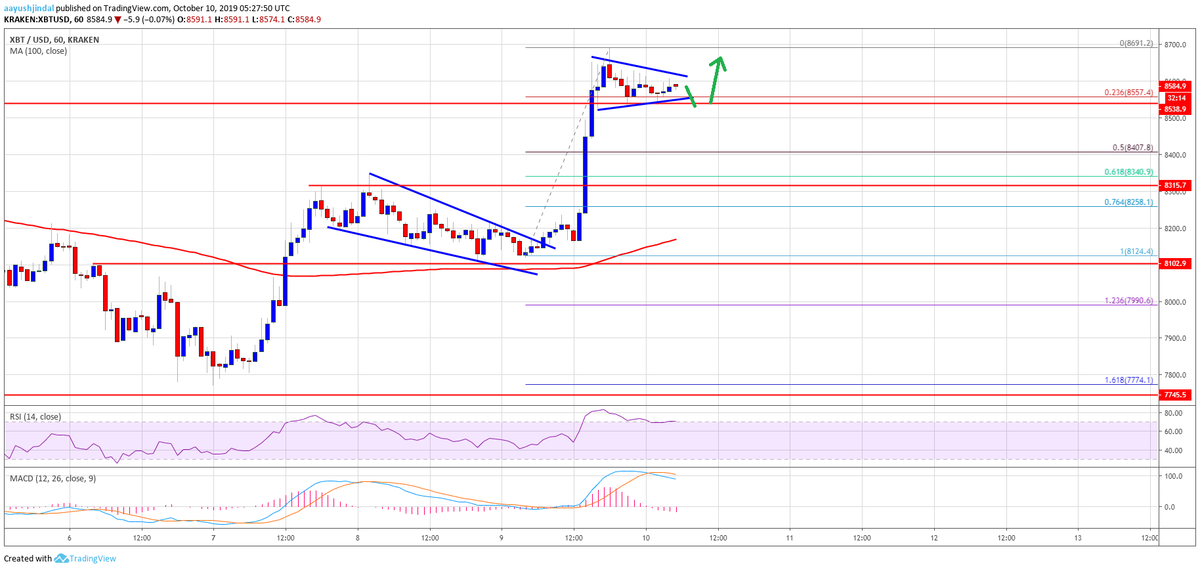
If there is a downside break below the $8,540 and $8,500 support levels, the price could extend its correction. The next key support is near the $8,400 level. Moreover, the 50% Fib retracement level of the recent rally from the $8124 low to $8,691 high is also near the $8,407 level. If there are any additional losses, the price may perhaps test the $8,350 support area (the recent key resistance).
8,540ドルと8,500ドルのサポートを下抜けると、価格はさらに下落する可能性があります。次の重要なサポートは8,400ドル付近です。さらに、最近の上昇(8124ドル〜8,691ドル)の50% Fibリトレースメントレベルも8,407ドル付近にあります。ここからさらに下落すると、価格は8,350ドルのサポートエリア(最近の重要なレジスタンス)を試すかもしれません。

The 61.8% Fib retracement level of the recent rally from the $8124 low to $8,691 high is also near the $8,340 level to provide support. On the upside, an immediate resistance is near the $8,620 level. If there is an upside break above $8,620 and $8,650, the price is likely to accelerate towards the $8,800 level.
最近の上昇(8124ドル〜8,691ドル)の61.8% Fibリトレースメントレベルも8,340ドル付近にありサポートとなるでしょう。上昇時の直近のレジスタンスは8,620ドル付近です。8,620ドルと8,650ドルを上抜けると、8,800ドル台に向けて上昇を加速する可能性が高くなるでしょう。
Looking at the chart, bitcoin is clearly trading in a positive zone above the $8,500 pivot level. In the short term, there could be a downside correction, but the $8,400 and $8,350 levels are likely to protect losses.
チャートを見ると、ビットコインは明らかに8,500ドル以上のポジティブゾーンで取引されています。短期的には下落する可能性もありますが、8,400ドルと8,350ドル付近で下落が支えられる可能性が高いでしょう。
via: Bitcoin (BTC) Shows Signs of Important Reversal, $8.8K Next?
_


