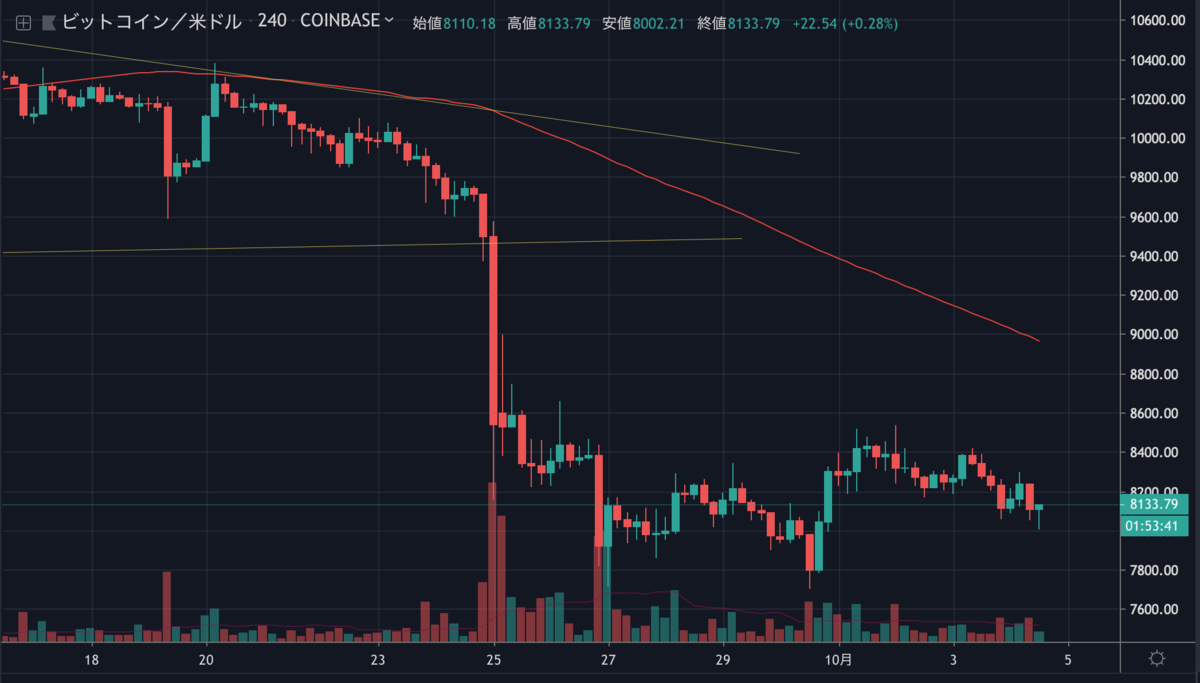
先月急落したビットコインは、その後10日間にわたりレンジ相場を形成し、コメントに困る地味な展開が続いています。

海外の掲示板 reddit では、過去にビットコインの価格予想を的中させてきた匿名ユーザの次の予想(今月中に1万6000ドル)が当たるかどうかが注目されています。しかし、この予想が的中するには現在価格から約2倍に高騰する必要があります。
テクニカル的に今後の値動きはどのように予想されるのでしょうか。
NEWS BTCでチャート分析を見てみます。
ビットコインのチャート分析
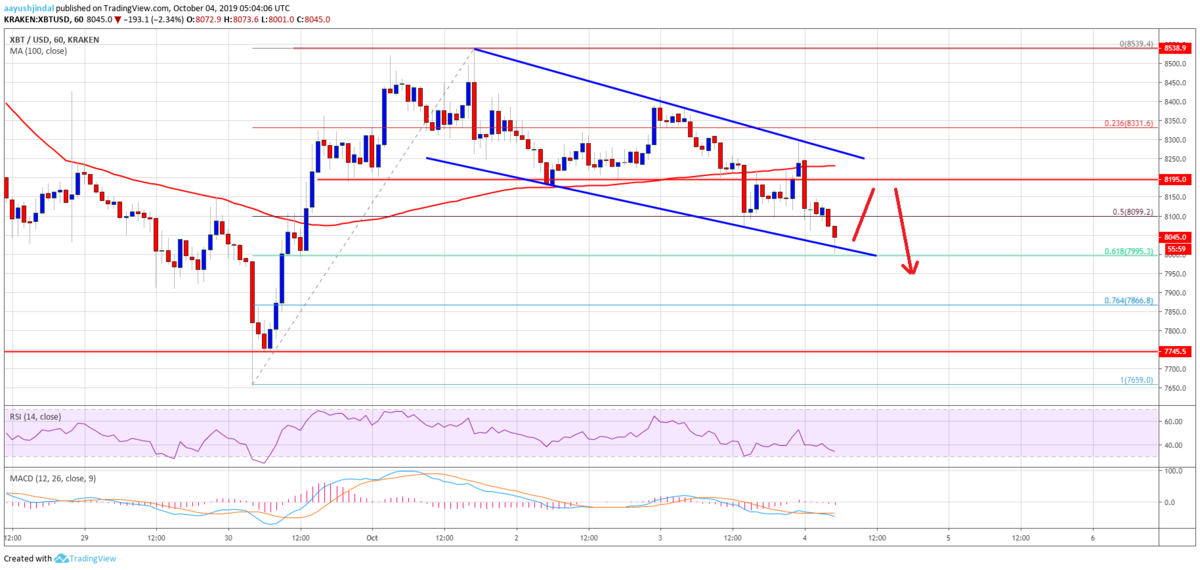
It seems like there is a key declining channel forming with resistance near the $8,260 level on the hourly chart of the BTC/USD pair. Thus, if there is a downside break below the $8,000 support, the price could accelerate its decline towards the $7,800 support area.
BTC/USDペアの時間足チャートには、8,260ドル付近でレジスタンスとなる重要な下降チャネルが形成されているように見えます。そのため、8,000ドルのサポートを下抜ける場合、価格は7,800ドルのサポートに向けて下落を加速する可能性があります。

On the upside, there is a solid resistance forming near the $8,250 level and the 100 hourly SMA. Therefore, if there is an upside break above $8,250 and $8,300, the price could trade towards the main $8,500 resistance level in the near term.
上側には、8,250ドルと100時間SMA付近に強いレジスタンスが形成されています。そのため、8,250ドルと8,300ドルを上抜けると、近いうちに主要なレジスタンスである8,500ドルに向けて上昇する可能性があります。
Looking at the chart, bitcoin is clearly struggling to climb above the $8,300 level. Therefore, there is a risk of a downside break below the $8,000 support. In the mentioned case, the price could test the $7,800 support or trade to a new monthly low before it starts a decent recovery towards $9,000.
チャートを見ると、ビットコインは明らかに8,300ドルを超えられずに苦戦しています。そのため、8,000ドルのサポートを下抜けて下落する恐れがあります。その場合、9,000ドルへ向けた堅実な回復を始める前に、7,800ドルのサポートを試すか最安値を更新する可能性があります。
via: Bitcoin Price (BTC) Downside Thrust Underway Before Fresh Rise
_


