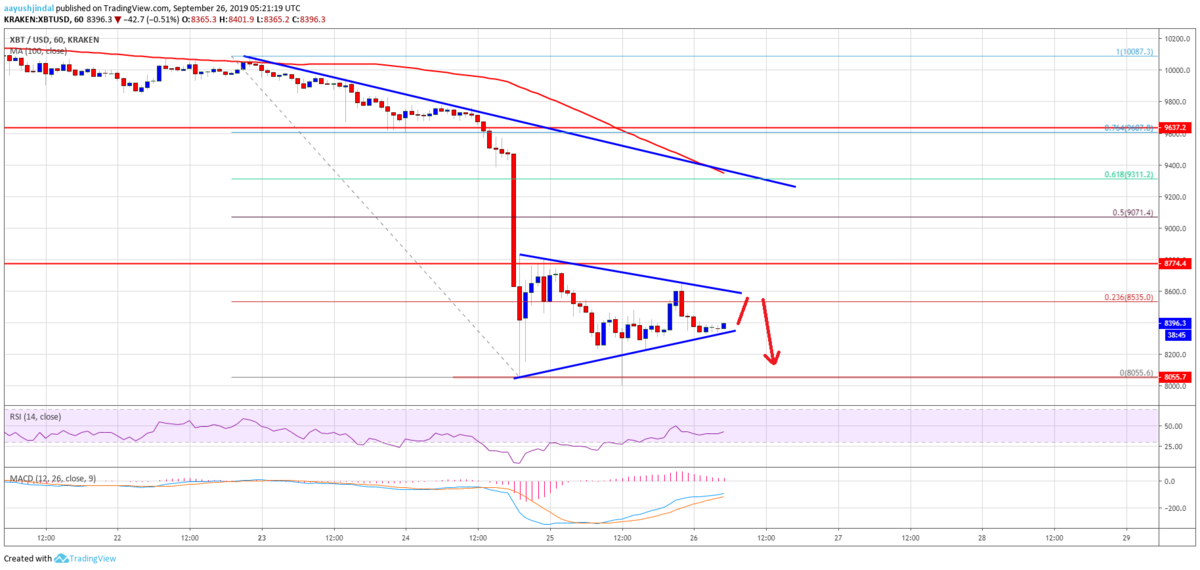
ビットコインは昨日の急落以降回復する様子がなく、現在は8,400ドル付近で取引されています。
このような時期は上昇に期待し続けるよりも、ショートで利益を得ることも視野に入れた方が良いでしょう。
さて、NEWS BTC先生は今後の展開をどのように予想しているのでしょうか。
ビットコインのチャート分析
To start a strong recovery, bitcoin price must surpass the $8,600 and $8,800 resistance levels. The next key resistance is near the $9,000 and $9,080 levels.
ビットコインが力強い回復を始めるには、8,600ドルと8,800ドルのレジスタンスを超える必要があります。次の重要なレジスタンスは、9,000ドルと9,080ドル付近です。

Conversely, if the price breaks the triangle support at $8,320, there could be a fresh decline. An immediate support is near the $8,200 level, below which the price is likely to revisit the $8,000 support area. Any further losses is likely to open the doors for a drop to $7,500.
逆に、価格がトライアングルサポートの8,320ドルを下抜けると、さらに下落する可能性があります。直近のサポートは8,200ドル付近、これを下抜けると、再び8,000ドルのサポートに届く可能性が高いでしょう。さらに下落すると、7,500ドルまで下げる可能性があります。
Looking at the chart, bitcoin seems to be preparing for the next break either above $8,600 or towards $8,000. The chances of a downside break are high considering the technical structure below $8,000 and the current price action.
チャートを見ると、ビットコインは8,600ドル以上または8,000ドルへ向けた次のブレイクに備えているようです。8,000ドル以下のテクニカル的構造と現在の値動きを考慮すると、下方向へのブレイクの可能性が高そうです。
via: Bitcoin Price (BTC) Sighting Next Downside Break Below $8.2K
_


