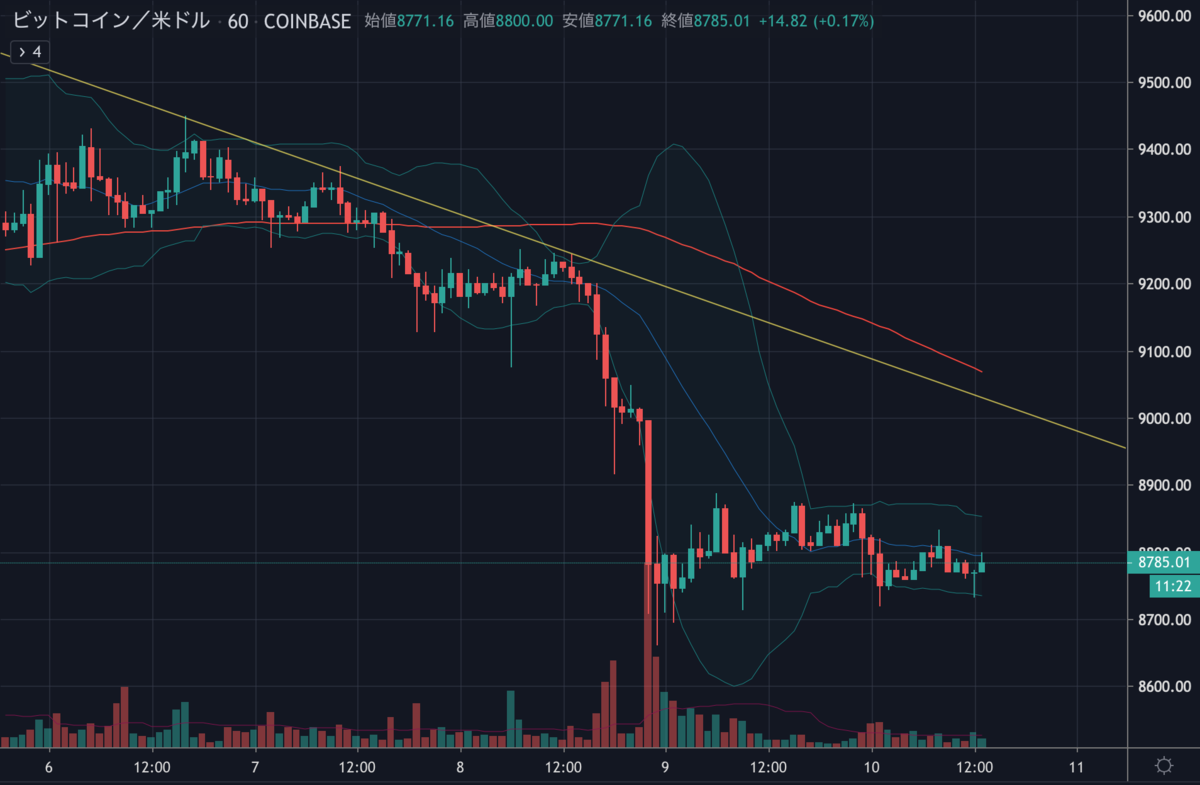
しばらくレンジ内で取引されていたビットコインが下落しました。
このような大きな動きはトレンドフォロワーにとっては美味しい展開ですが、ホルダーの人や逆張りの人には少々厳しいかもしれません。

なかなか上昇相場に転じないBTCですが、今後の値動きはどのように予想されるのでしょうか。
NEWS BTCでビットコインのチャート分析を見てみます。
ビットコインのチャート分析
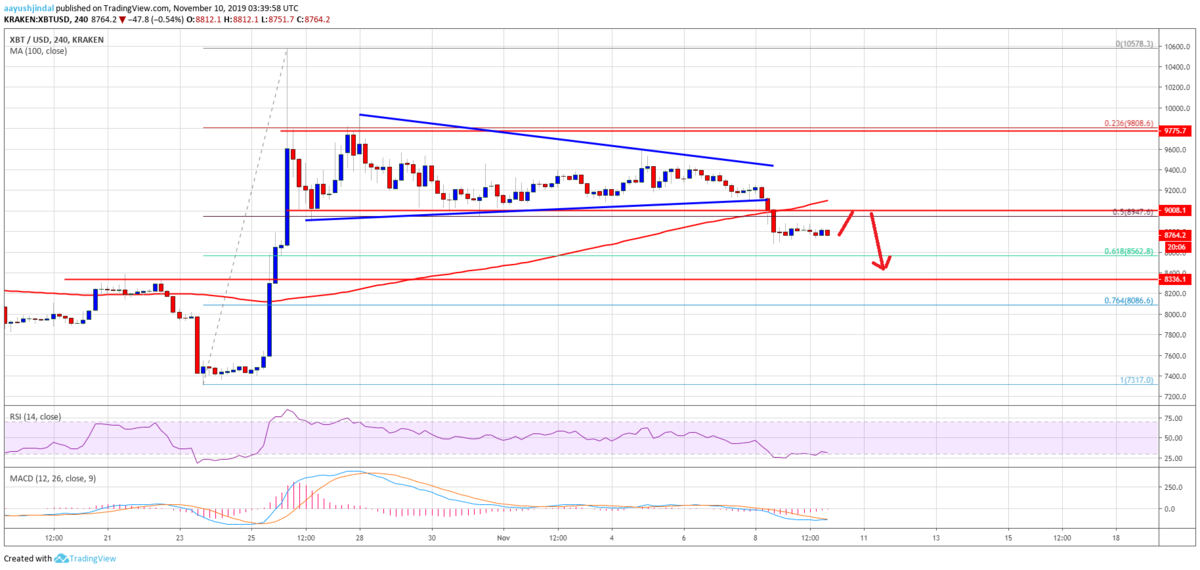
At the moment, the price is consolidating below the $9,000 and $8,900 levels. An immediate support is near the $8,600 and $8,560 levels.
現在、ビットコインの価格は9,000ドルと8,900ドルの水準を下回っています。直近のサポートは8,600ドルと8,560ドル付近です。

If there are more downsides, the price could slide towards the $8,330 and $8,300 support levels. The mentioned $8,300 area acted as a resistance earlier and now it is likely to provide support.
さらに下落する場合は、価格は8,330ドルと8,300ドルのサポートレベルに向かう可能性があります。8,300ドルエリアは、以前はレジスタンスとして機能していたものの、現在はサポートになる可能性が高いでしょう。
On the upside, the recent support area near the $9,000 level could act as a resistance. Besides, the 100 simple moving average (4-hours) is a major hurdle near the $9,100 level. Therefore, a successful close above $9,100 is needed for more gains in the near term.
上昇時は、9000ドル付近の最近のサポートエリアがレジスタンスとして機能するでしょう。さらに、100期間SMA(4時間)が9,100ドル付近で大きなハードルになります。そのため、短期的にさらに上昇するには9,100ドル以上で引ける必要があります。
Looking at the chart, bitcoin price is clearly trading in a bearish zone below the $9,000 support and the 100 simple moving average (4-hours). Thus, there are high chances of more losses towards the $8,560 support or $8,300 pivot area.
チャートを見ると、ビットコインの価格は明らかに9,000ドルのサポートと100期間SMA(4時間足)以下の弱気ゾーンで取引されています。そのため、8,560ドルのサポートまたは8,300ドルのピボットエリアに向けて、さらに下落する可能性が高いでしょう。
via: Bitcoin (BTC) Price Weekly Forecast: More Downsides Likely
_


