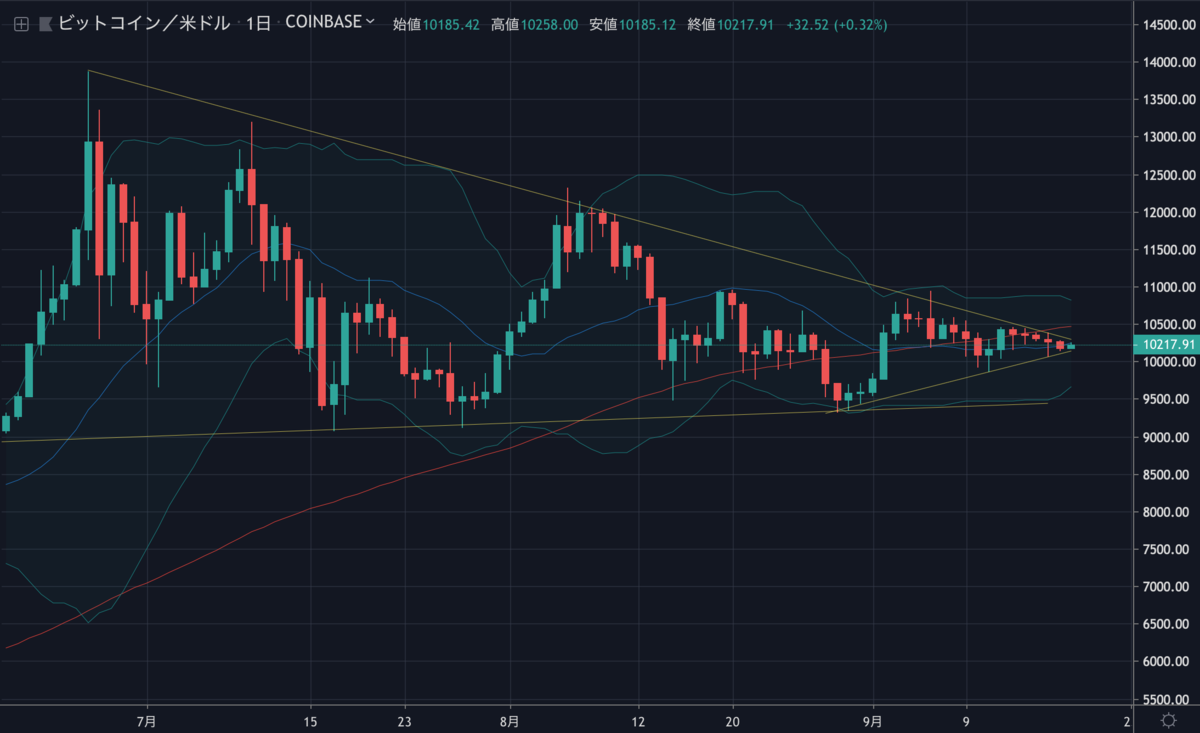
ビットコインは相変わらず三角保ち合いの中で推移しており、値動きはどんどん小さくなっています。

一方、アルトコインのイーサリアム(ETH)の価格は数日前から上昇しており、昨日はリップル(XRP)も急騰しました。ビットコインの資金がアルトコインに流れているのでしょうか。
今はアルトコインに分散投資する方が旨みがありそうですが、それはそれとしてNEWS BTCのチャート分析を見てみます。
ビットコインのチャート分析
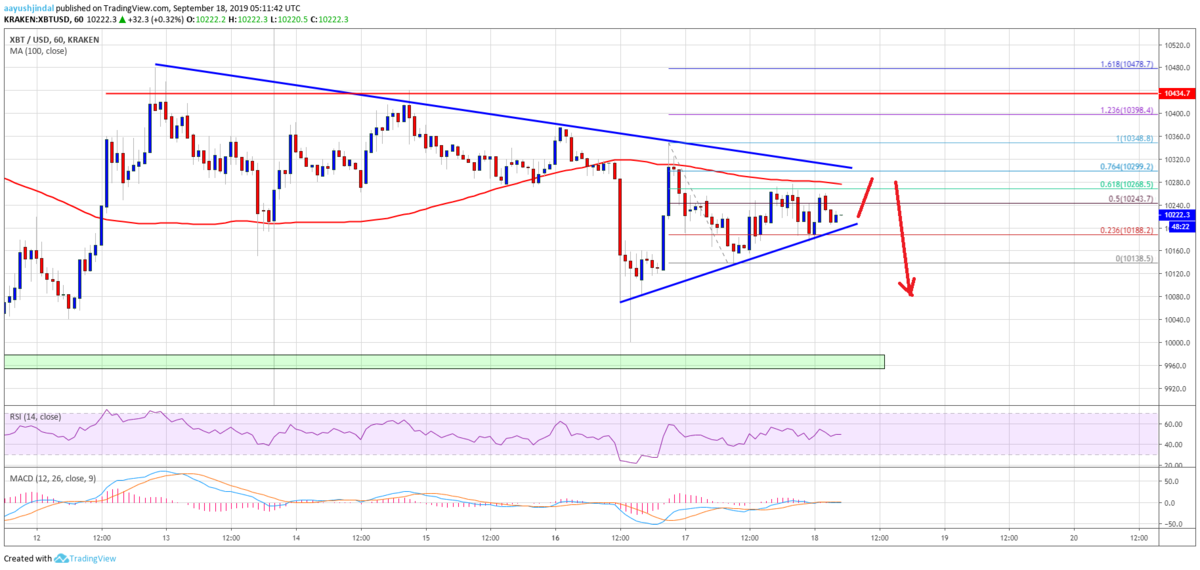
There are many hurdles on the upside near $10,270, $10,300, and the 100 hourly SMA. If there is an upside break above the $10,300 level and the 100 hourly SMA, the price could continue higher. The next key resistances are near the $10,400 and $10,440 levels.
上方には10,270ドル、10,300ドル、100時間SMA(単純移動平均線)などの多くの障害があります。10,300ドルと100時間SMAを上抜けることができれば、価格は上昇を続ける可能性があります。次の重要なレジスタンスは10,400ドルと10,440ドル付近になります。

Conversely, if the price continues to struggle below $10,300, there could be a downside break. An immediate support is near the $10,200 level. A convincing break and follow through below $10,200 will most likely push the price towards the $10,000 support. The main support is near the $9,900, below which there could be a nasty drop towards $9,500 or $9,200.
逆に、価格が10,300ドル以下で苦戦を続ける場合は、下方にブレイクする可能性があります。直近のサポートは10,200ドル付近。10,200ドルをはっきり下抜けて下落すると、10,000ドルのサポートに向かう可能性が高くなります。主なサポートは9,900ドル付近、これを下回ると9,500ドルから9,200ドルにまで下落する可能性があります。
Looking at the chart, bitcoin price is clearly preparing for the next move and it could either rally above $10,400 or it might extend its decline towards the $9,900 support. The price action indicates high chances of a bearish reaction unless the bulls push the price above $10,300.
チャートを見ると、ビットコインの価格は明らかに次の動きに備えており、10,400ドルを超えるか、9,900ドルのサポートに向けてさらに下落するかのどちらかでしょう。この値動きは、価格が10,300ドルを超えない限り、弱気の反応の可能性が高いことを示しています。
via: Bitcoin Price (BTC) Trading Near Make-or-Break Levels
_


