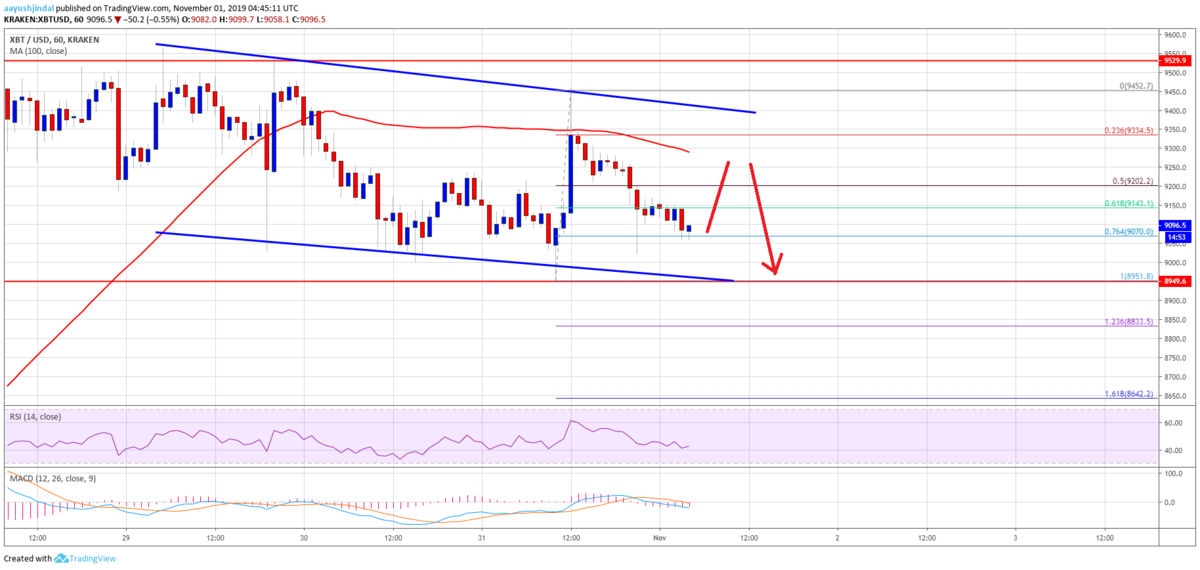
昨日のビットコインは一時9,400ドル台まで上昇したものの、再び下落して9,200ドルを割り込みました。現在は9,130ドル付近で取引されています。
下降チャネル内で徐々に下落しつつあるビットコインの今後の値動きはどのように予想されるのでしょうか。
NEWS BTCのチャート分析を見てみます。
ビットコインのチャート分析
It seems like the 76.4% Fib retracement level of the upward move from the $8,951 low to $9,452 high is acting as a decent support. However, the main support is near the $9,000 level, below which there is a risk of an extended decline towards the $8,950 and $8,830 levels.
上昇の動き(8,951ドル〜9,452ドル)の76.4% Fibリトレースメントレベルが強いサポートとして機能しそうです。しかし、メインサポートは9,000ドル付近で、これを下抜けると、8,950ドルと8,830ドルに向けてさらに下落する恐れがあります。

On the upside, there are many hurdles near the $9,200 and $9,300 levels. More importantly, the 100 hourly simple moving average is also near the $9,300 level to act as a hurdle.
上昇する場合は、9,200ドルと9,300ドル付近に多くのハードルがあります。さらに重要なのは、100時間SMA(単純移動平均線)も9,300ドル付近でハードルとして機能することです。
Finally, there is a declining channel forming with resistance near $9,400 on the hourly chart of the BTC/USD pair. Therefore, the price must climb above $9,300 and $9,400 to start a strong rise in the near term.
最後に、BTC/USDペアの時間足チャートで、9,400ドル付近でレジスタンスとなる下降チャネルが形成されています。そのため、短期的に強い上昇を始めるには、9,300ドルと9,400ドルを超える必要があります。
via: Bitcoin (BTC) Price Trading Near Make-or-Break Levels
_


