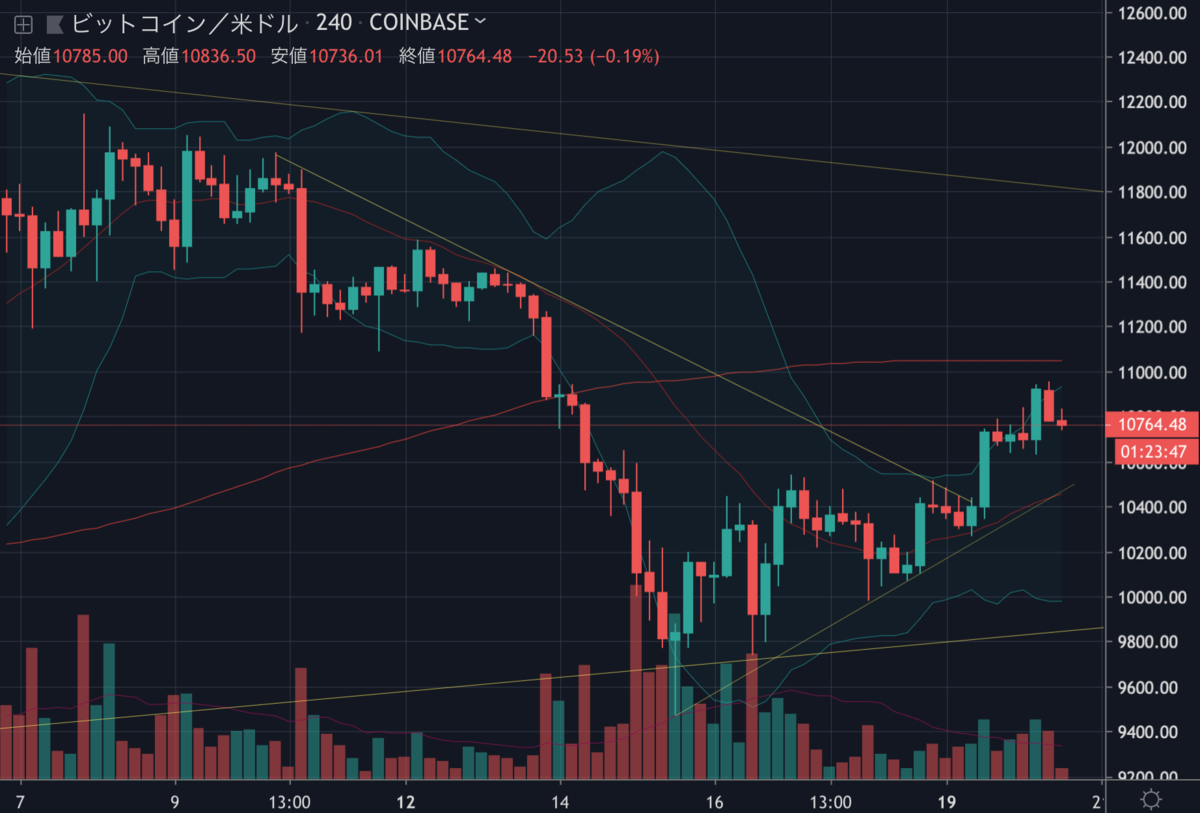
昨日のビットコインはNEWS BTCの予想図通りの展開で、10,600ドルを突破した後、11,000ドルにせまる勢いで高騰しました。記事執筆時点では少し戻して10,700ドル付近で取引されています。

上方にはまだいくつかのレジスタンス(抵抗線)が待ち構えていそうですが、今後の値動きはどのように予想されるのでしょうか。NEWS BTCのチャート分析を見てみます。
ビットコインのチャート分析
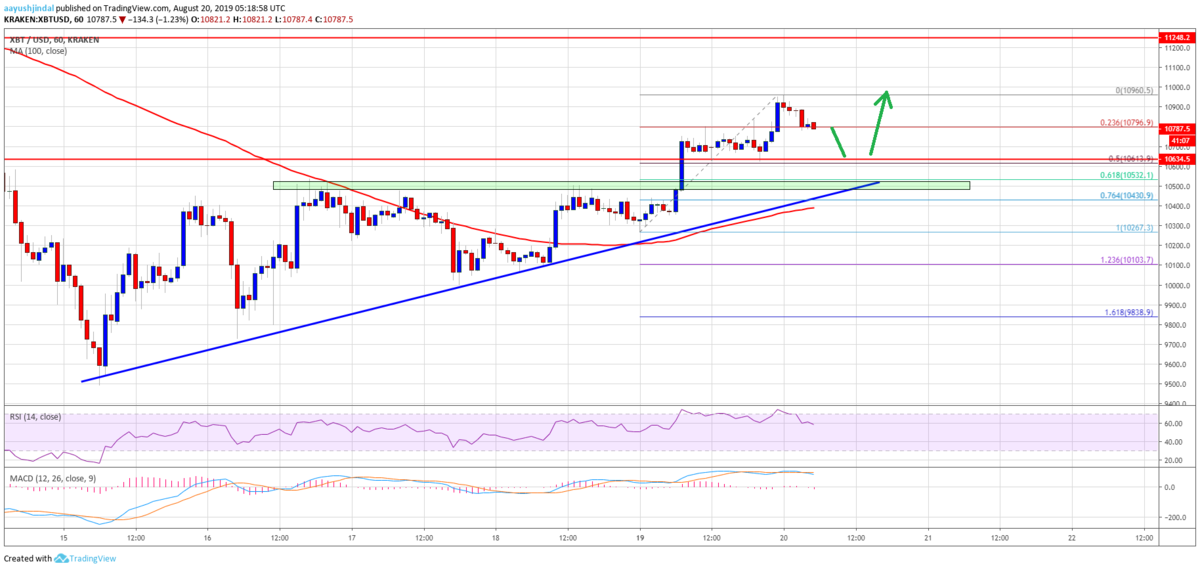
An immediate support is near the $10,600 level (the previous resistance). Additionally, the 50% Fib retracement level of the recent wave from the $10,267 low to $10,960 high is near the $10,600 level.
直近のサポートは10,600ドル付近(以前のレジスタンス)。さらに、最近の波(10,267ドル〜10,960ドル)の50% Fibリトレースメントレベルが10,600ドル付近にあります。

If there is a bearish break and close below $10,500 plus the 100 hourly simple moving average, the price could move back into a bearish zone.
10,500ドルと100時間SMA(単純移動平均線)を下抜けて引けた場合は、価格は弱気ゾーンまで戻る可能性があります。
On the upside, an immediate resistance is near the recent high at $10,960, followed by $11,000. If the price continues to rise, the next important resistance is near the $11,200 and $11,250 levels.
上昇時の直近のレジスタンスは、最近の高値10,960ドル付近、続いて11,000ドルになります。価格が上昇を続ければ、次の重要なレジスタンスは11,200ドルと11,250ドル付近になります。
Looking at the chart, bitcoin price is trading nicely above the $10,500 support level. As long as there is no daily close below $10,500, there are high chances of more upsides towards $11,200 in the coming sessions. Additionally, if the bulls remain in action, they might be able to push the price towards the $11,400 level.
チャートを見ると、ビットコインの価格は順調に10,500ドルのサポートレベル以上で取引されています。日足の終値が10,500ドル以下で引けない限り、今後は11,200ドルに向けてさらに上昇する可能性が高くなります。さらに、買いが続けば11,400ドルまで押し上げられる可能性があります。
via: Bitcoin (BTC) Price Could Revisit $11.2K or $11.4K
_


