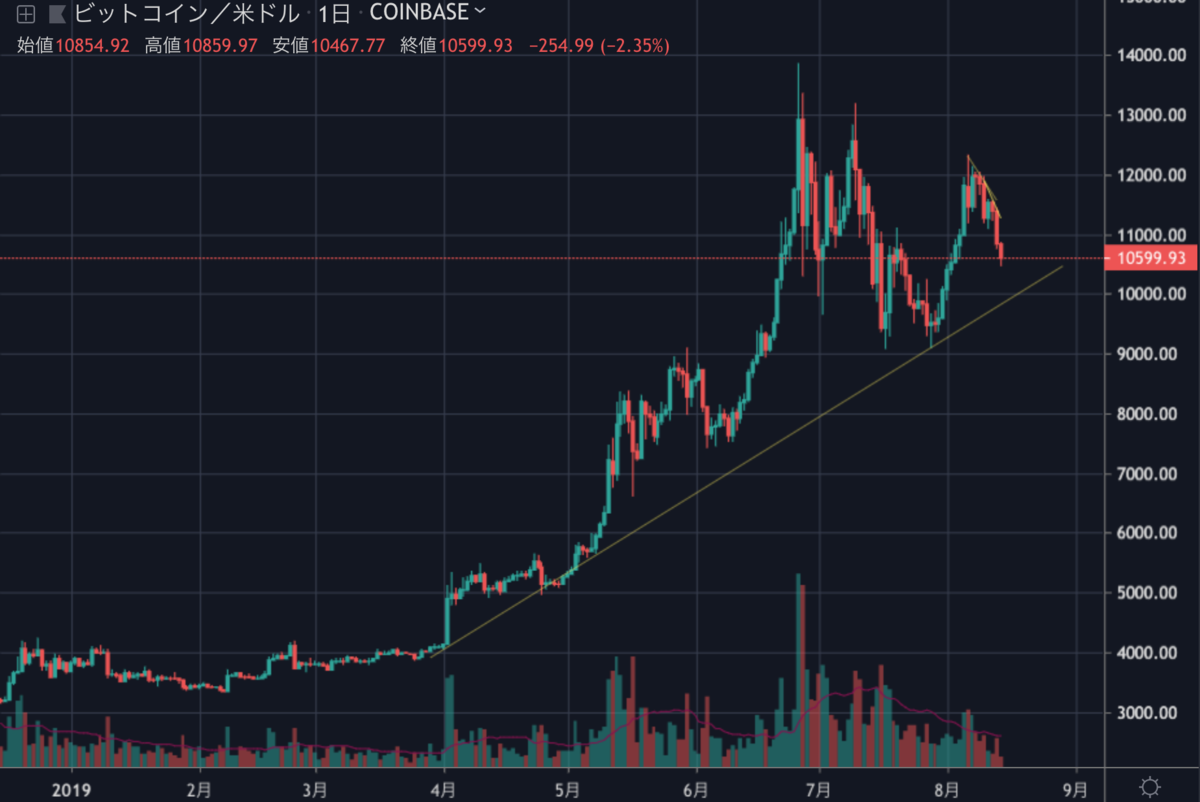
超大型の台風10号(クローサ)がゆっくりと接近し、15日(木)西日本に上陸する見込みです。それはさておき、昨日のビットコインはサポートを下抜け11,000ドルを割り込みました。
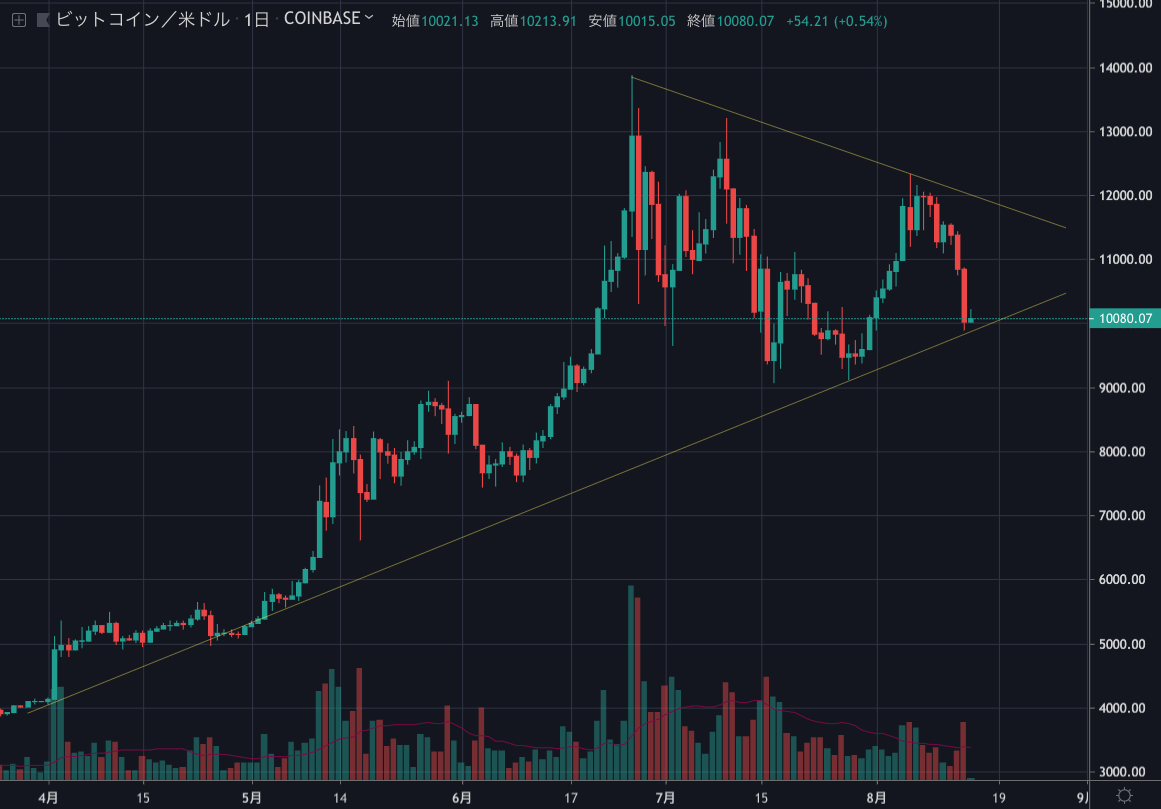
ちなみに今年1月からの値動きはこのとおり。ふむー。

今後の値動きはどのように予想されるのでしょうか。NEWS BTCのチャート分析を見てみます。
[8/15 9:30 追記]
きっちりサポートラインまで下げてきました。わかりやすいなお前。

ビットコインのチャート分析
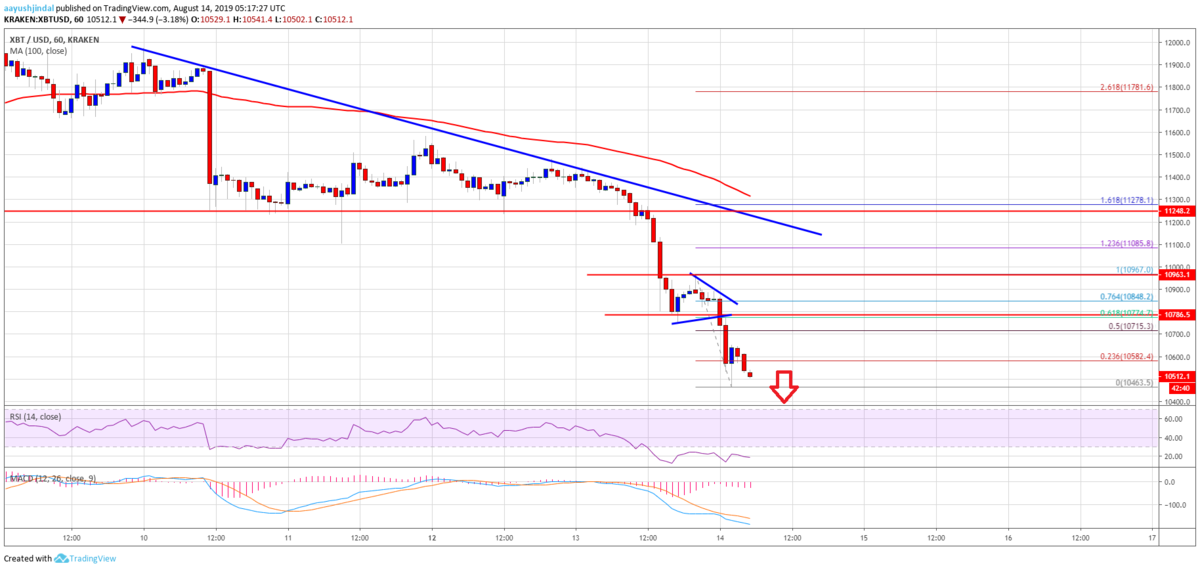
The main resistance is near the $11,200 level (this week’s support area). On the downside, an immediate support is near the $10,450 level. If there is a bearish break, the price could slide further towards the $10,200 level. The main support is near the $10,000 level, where the bulls might take a stand.
主なレジスタンスは11,200ドル付近(今週のサポートエリアだった価格帯)。下落時は、直近のサポートが10,450ドル付近にあります。それを下抜ける場合、価格は10,200ドルへ向けてさらに下落するでしょう。主なサポートは10,000ドル付近で、ここで強気派が買いに入る可能性があります。

Looking at the chart, bitcoin price is gaining bearish momentum below $11,000 and $10,800. Therefore, there are chances of more downsides below $10,500 and $10,450. Conversely, if there is an upside correction, the price is likely to face resistance near the $10,700 and $10,800 levels.
チャートを見ると、ビットコインの価格は11,000ドルと10,800ドル以下で下落の勢いを増しています。そのため、10,500ドルと10,450ドルを下回ってさらに下落する可能性があります。逆に、上昇に転じる場合は、10,700ドルと10,800ドル付近でレジスタンスに直面するでしょう。
via: Bitcoin (BTC) Price Hits Weekly Bearish Target: $10K Could Be Next
_


