




昨日のビットコインは、下降トレンドラインを上抜け12,000ドルを突破したものの、その後急落しました。一時は11,200ドル付近まで下落しましたが、現在は11,600ドル付近で取引されています。
今回もNEWS BTCのチャート分析を見てみます。
ビットコインのチャート分析
The next key resistances are near $12,200 and $12,350. Conversely, if the price fails to surpass the $11,850 and $12,000 levels, there could be another decline. An immediate support is near the $11,500 level. The main support is near the $11,200 level and the 100 hourly SMA.
次に重要なレジスタンスは12,200ドルと12,350ドル付近。逆に、価格が11,850ドルと12,000ドルの突破に失敗した場合は、再び下落する恐れがあります。直近のサポートは11,500ドル付近。主なサポートは11,200ドルと100時間SMA(単純移動平均線)になります。
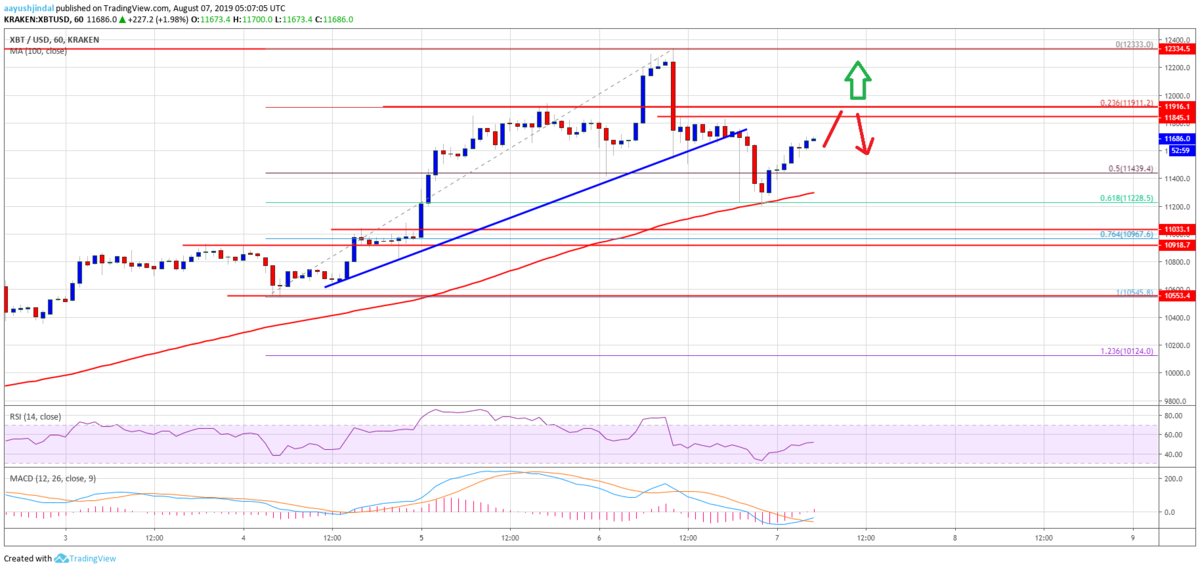
Looking at the chart, bitcoin price is clearly facing an uphill task near the $11,850 and $12,000 resistance levels. Having said that, the price is likely to gain bullish momentum as long as it is trading above the $11,200 support and the 100 hourly SMA
チャートを見ると、ビットコインの価格は明らかに11,850ドルと12,000ドルのレジスタンス付近で障壁に直面しています。とは言え、11,200ドルのサポートと100時間SMA以上で取引されている限り、価格は強気の勢いを得る可能性が高いでしょう。
via: Bitcoin Price (BTC/USD) Is Holding Uptrend Support But $12K Holds Key
_


