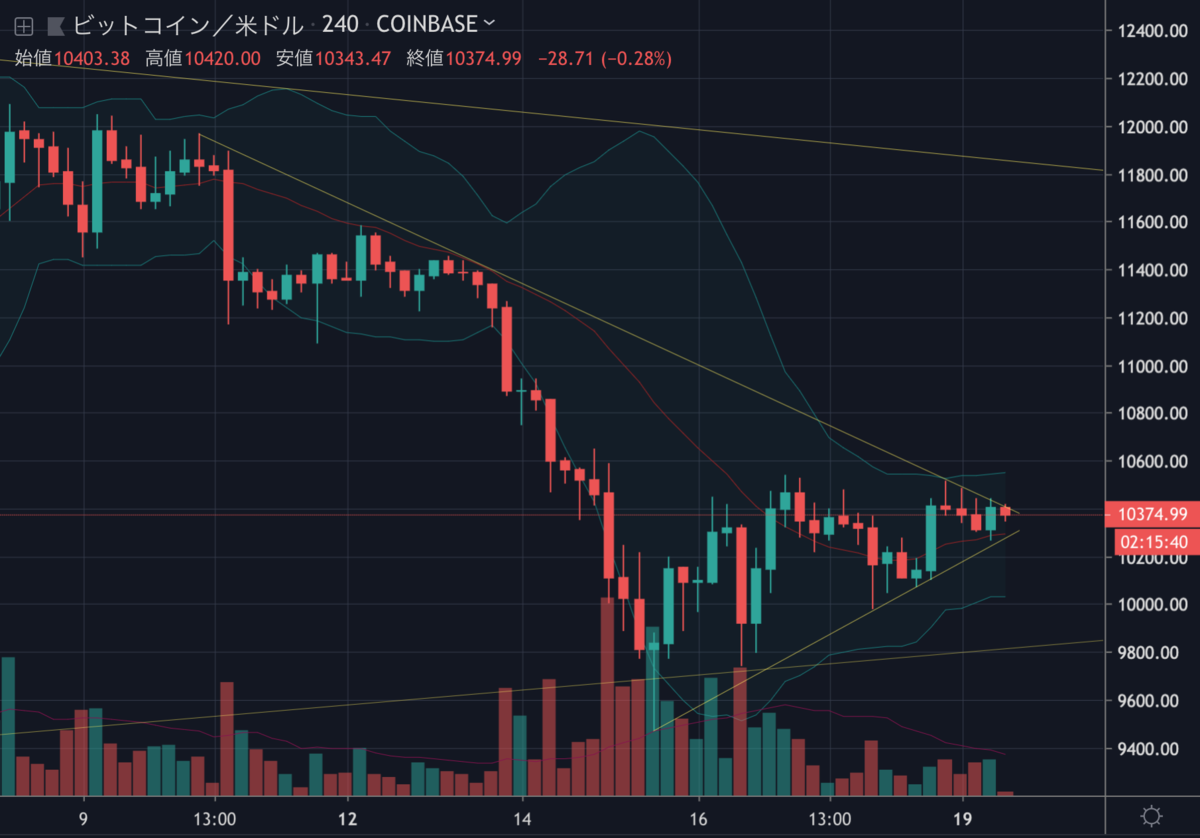
昨日のチャート分析は下落予想でしたが、幸いにも予想は外れ、その後やや上昇、現在は安値を切り上げながら新たな三角保ち合いを形成しています。

今後レジスタンスを上抜け、上昇トレンドが再開する可能性はあるのでしょうか。NEWS BTCのチャート分析を見てみます。
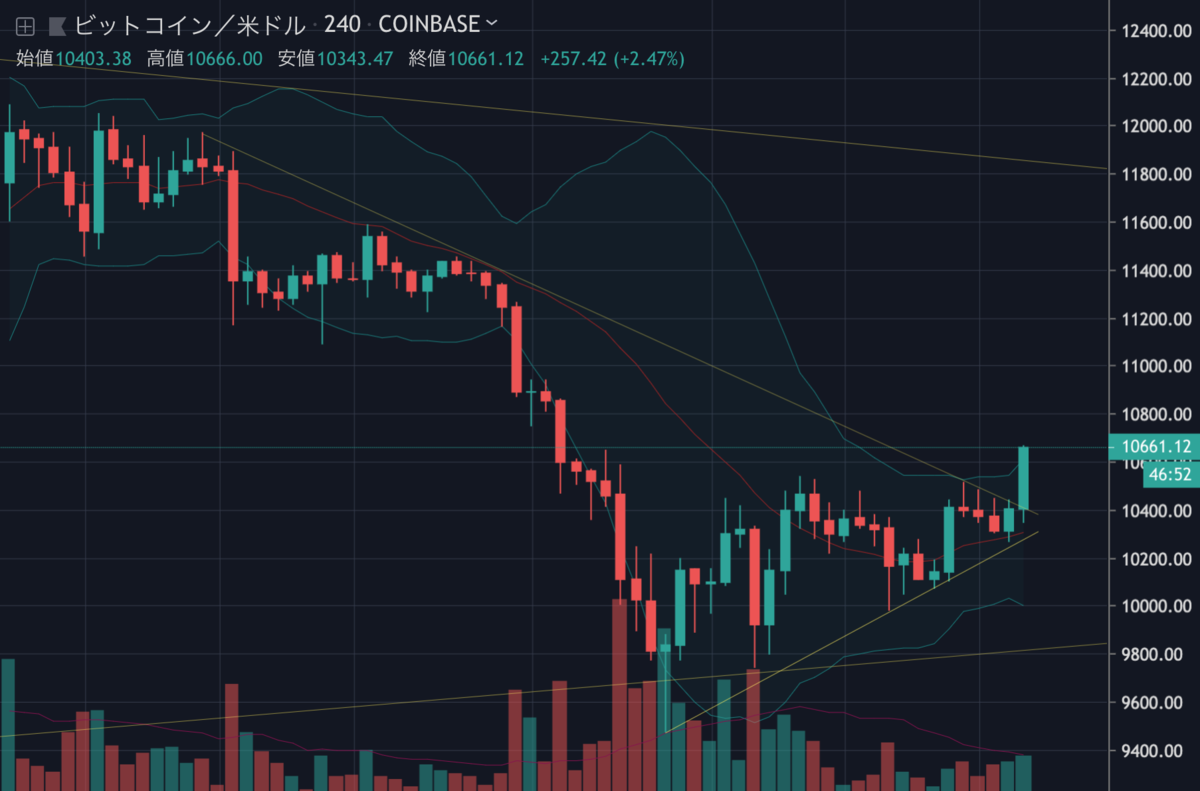
[16:15 追記]
上にブレイクアウトしました。NEWS BTCのチャート分析最強かよ。
さて、このまま10,600ドル以上を維持できるかどうか・・・。

ビットコインのチャート分析
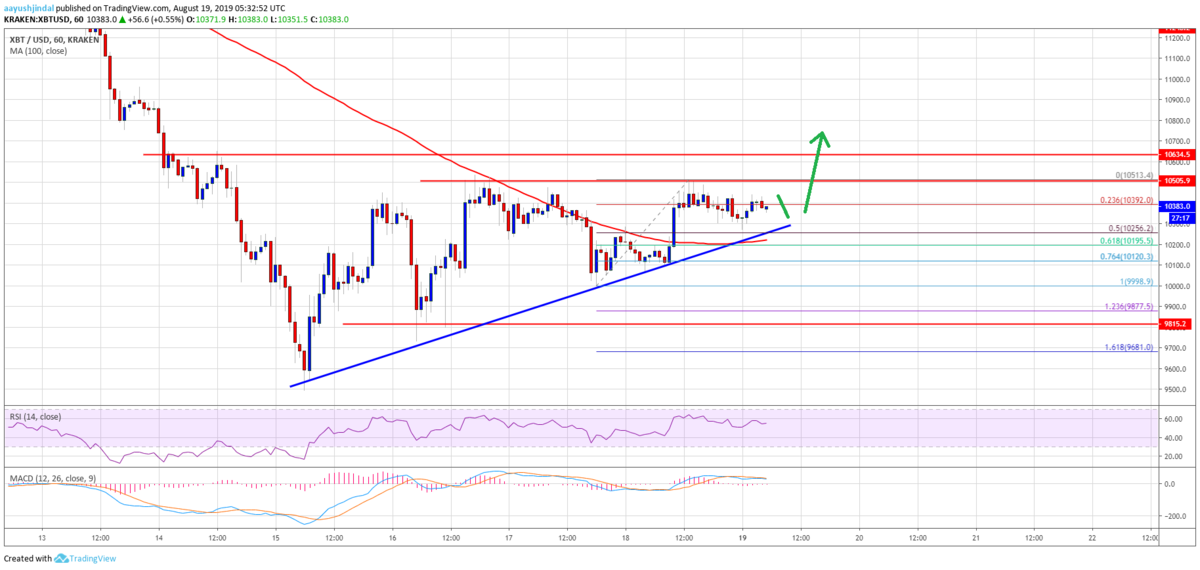
On the downside, there is a decent support forming near the $10,250 and $10,200 levels. Additionally, there is a connecting bullish trend line forming with support near $10,250 on the hourly chart of the BTC/USD pair.
下落する場合、10,250ドルと10,200ドル付近に強いサポートが形成されています。さらに、BTC/USDペアの時間足チャートには、10,250ドル付近でサポートとなる上昇トレンドラインが形成されています。

On the upside, the price is clearly facing a strong resistance near the $10,500 and $10,600 levels. Therefore, a convincing break above the $10,600 level is needed for the bulls to gain traction. In the mentioned case, the price could accelerate higher towards the $10,800 and $11,000 resistance levels.
上昇する場合、明らかに10,500ドルと10,600ドル付近に強いレジスタンスが控えています。そのため、強気派が勢いを得るには、10,600ドルをしっかりと上抜ける必要があります。その場合、10,800ドルと11,000ドルのレジスタンスに向けて加速する可能性があります。
Looking at the chart, bitcoin price is approaching a crucial breakout point and it could either climb above $10,600 or start a fresh decline below $10,200. As long as there is no close above $10,500 and $10,600, the price remains at a risk of more losses. The main supports below $10,200 are near $10,000 and $9,800.
チャートを見ると、ビットコインの価格は重要なブレイクアウトポイントに近付きつつあり、これから10,600ドルを突破してさらに上昇するか、あるいは10,200ドルを下抜け再び下落を始めるかという状況です。10,500ドルと10,600ドル以上で引けない限り、価格はさらに下落する恐れがあります。10,200ドル以下の主なサポートは10,000ドルと9,800ドル付近になります。
via: Bitcoin (BTC) Price Could Accelerate If It Breaks $10,600
_


