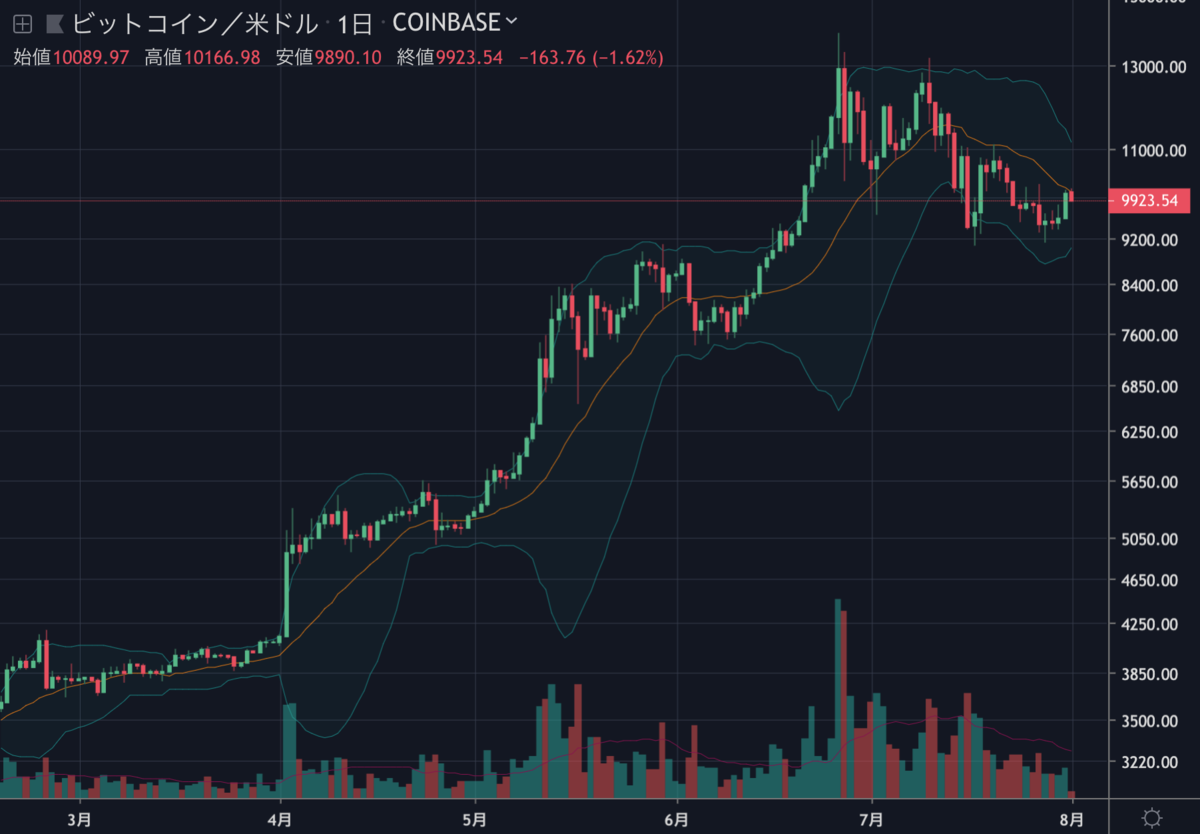
ビットコインは31日に急反発し、一時は10,200ドルに迫る勢いで上昇しました。記事執筆時点では少し価格を戻して9,900ドル付近を推移しています。
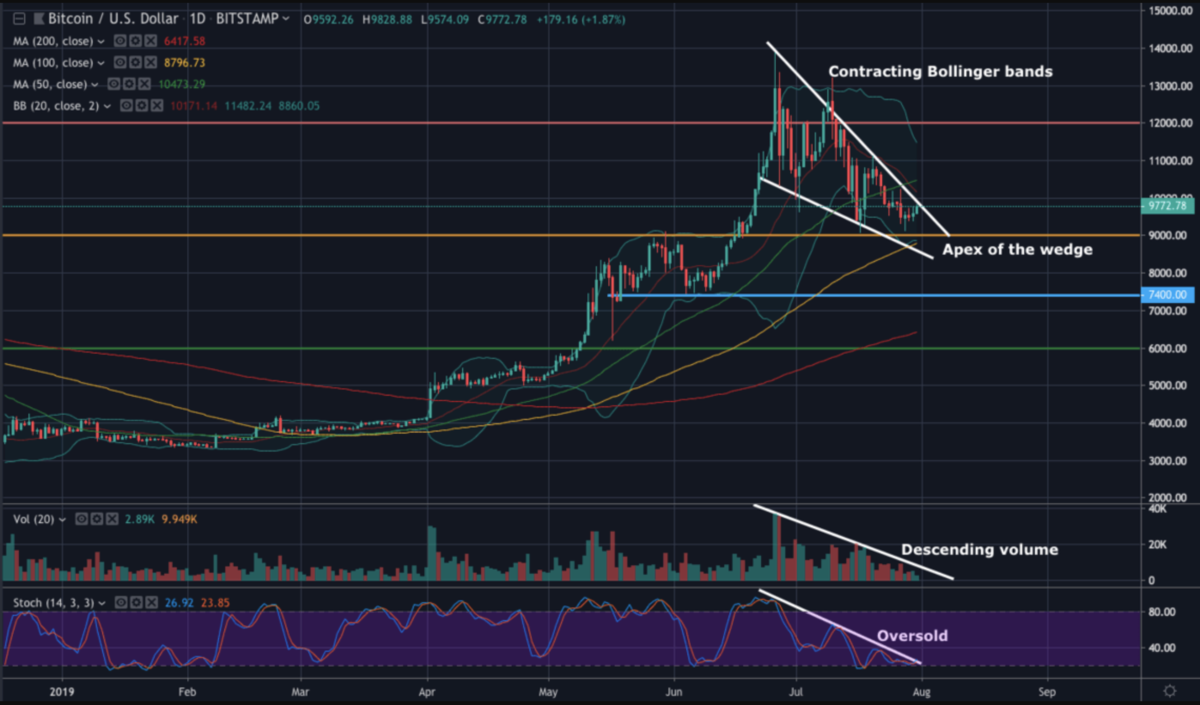
CCNの記事によると、現在のビットコインは日足チャートで下降ウェッジを形成しており、ストキャスティクスも売られすぎ状態に迫っているため、間もなく急騰するのではないかと予想されています。
ビットコイン急騰の前兆か
Looking at the daily chart, there’s no doubt that bitcoin has been in an uptrend since February 2019. In addition to that, there are multiple signals that predict a bullish breakout.
日足チャートを見ると、ビットコインは2019年2月以降上昇トレンドにあることは疑いようがありません。さらに、強気ブレイクアウトの予兆となる複数のシグナルが点灯しています。

First, we see the Bollinger bands contracting. This indicator tells us that the daily trading range is narrowing. The contraction of the bands actually affirms our assertion that a surge in volatility is on the horizon.
まず、ボリンジャーバンドの収縮が確認できます。このインジケーターは日々の取引レンジが縮小していることを示しており、バンドの収縮は、ボラティリティの急上昇が迫っているという主張を実質的に強めます。
Interestingly, the narrowing trading range coincides with the formation of a falling wedge. Now that the bands are contracting, we can see that the price is close to the apex of the wedge. Keep in mind, a falling wedge is a bullish continuation pattern. It often comes with a decrease in volume and momentum. We’re seeing those conditions on the daily chart.
興味深いことに、トレーディングレンジの縮小と同時に下降ウェッジが形成されています。バンドが収縮しているので、価格がウェッジの頂点に近いことが見て取れます。注意すべきは、下降ウェッジは強気の継続パターンになることです。これには出来高や勢いの減少がたびたび伴います。このような状況が現在の日足チャートに見られます。
Volume has been declining since June 26. In addition, the daily stochastics is flashing oversold readings.
出来高は6月26日以降減少しており、さらに、日足のストキャスティクスは売られすぎ状態を示しています。
A falling wedge breakout may likely send the bitcoin price close to $12,000. On the other hand, a breakdown may likely push the market down to $7,400.
下降ウェッジを上抜けることができれば、ビットコインの価格は12,000ドルにせまる可能性があります。逆に、下抜ける場合には、価格が7,400ドルまで下落する可能性が高くなります。
via: BITCOIN RALLY IS AROUND THE CORNER BASED ON THIS VOLATILITY INDICATOR
_


