先週の下落で1万ドルを割り込んだビットコイン(BTC)は、現在は9,500ドル付近で取引されています。日足チャートではダブルトップを形成しており、いくつかのインジケータで弱気シグナルが点灯しているため、このまま下落を続けると予想するアナリストも少なくありません。
NEWS BTCのチャート分析を見てみます。
ビットコインのチャート分析
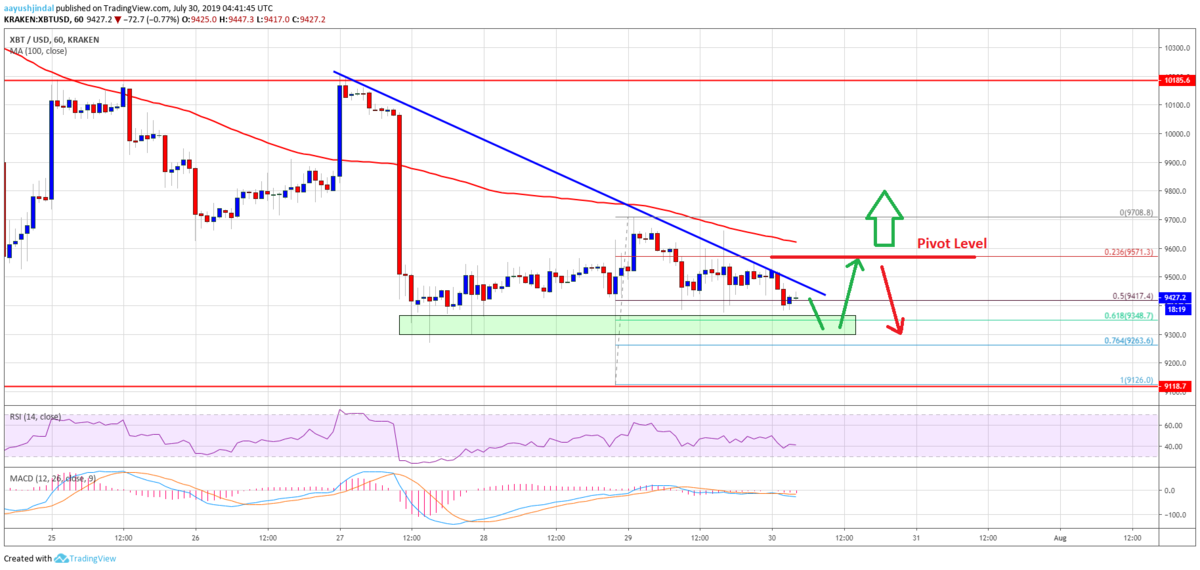
The main support is near the $9,300 area. Therefore, a downside break and close below the $9,300 support might push the price further lower. The next support is near $9,125, below which there is a risk of more losses below the $9,000 handle.
主なサポートは9,300ドル付近になります。そのため、下落して9,300ドルのサポート以下で引けると、価格はさらに下落する可能性があります。次のサポートは9,125ドル付近で、これを下回るとさらに9,000ドルを割り込むリスクがあります。

On the upside, there are many hurdles near the $9,500, $9,600 and $9,650 levels. Additionally, there is a connecting bearish trend line forming with resistance near $9,500 on the hourly chart of the BTC/USD pair. The key resistance is near the $9,650 level and the 100 hourly SMA. If there is a successful break above $9,600 and a follow through above $9,700, the price could start a solid upward move.
上側には、9,500ドル、9,600ドル、9,650ドル付近に多くのハードルがあります。さらに、BTC/USDペアの時間足チャートでは、9,500ドル付近でレジスタンスとなる下降トレンドラインが形成されています。重要なレジスタンスは9,650ドル付近と100時間SMAです。もし9,600ドルを上抜け9,700ドルを突破することができれば、価格は堅調に上昇を始めるでしょう。
Looking at the chart, bitcoin price is likely to start a slow and steady recovery above $9,600 and $9,700 as long as there is no bearish break below the $9,300 support level. In the bullish scenario, the price may perhaps recover towards the $10,000 and $10,200 resistance levels.
チャートを見ると、ビットコインの価格は、9,300ドルの支持線を下抜けることがない限り、ゆっくりと着実に9,600ドルと9,700ドルを上回る回復を始めると思われます。強気のシナリオでは、価格は10,000ドルと10,200ドルの抵抗線まで回復するでしょう。
via: Bitcoin Price (BTC/USD) Holding Key Support But Lacks Momentum
_


