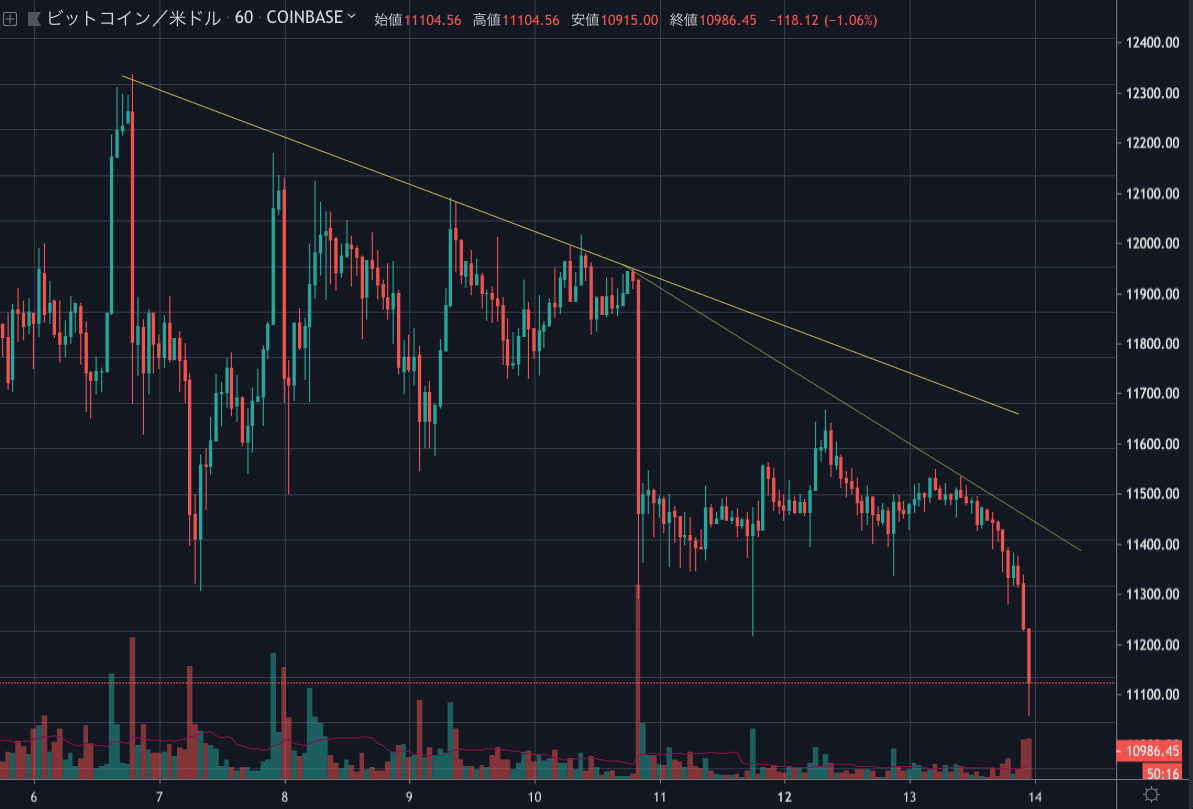
三角保ち合いから急落したビットコインは、11,500ドル付近で上昇を抑えられ、記事執筆時点では11,400ドル付近を推移しています。
テザーの発行量が増加しているため、ビットコインが2万ドルまで上昇すると予想するアナリストもいますが、短期的な値動きはどのように予想されるのでしょうか。NEWS BTCのチャート分析を見てみます。
[23:10 追記]
BTCが急落してほぼ予想図通りの展開になりました。
もう、この人の予想通りにトレードしたらいいんじゃね?(暴論)

ビットコインのチャート分析
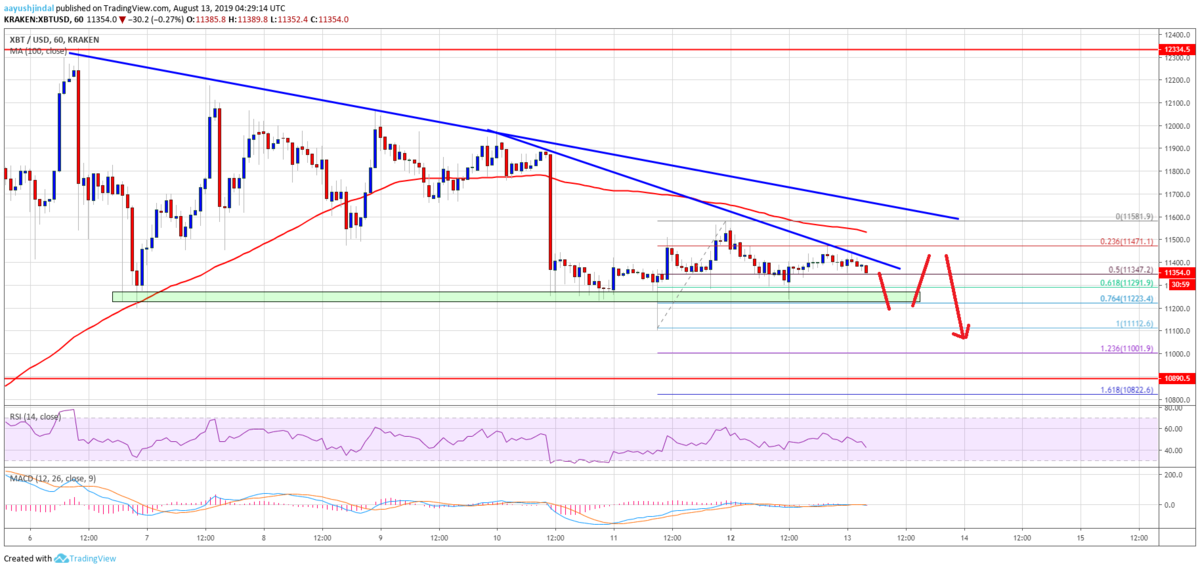
On the downside, there is a strong support near the $11,200 level. The 61.8% Fib retracement level of the upward move from the $11,112 low to $11,581 high might also act as a support. Therefore, a downside break below the $11,200 support could start another drop. The next major support is near $11,000, below which bitcoin price could decline towards $10,500 (as discussed in the weekly forecast).
下落する場合は、11,200ドル付近に強力なサポートがあります。11,112ドル〜11,581ドルの61.8% Fibリトレースメントレベルもサポートとして機能するかもしれません。そのため、11,200ドルのサポートを下抜けると、再び下落が始まる可能性があります。次の大きなサポートは11,000ドル付近。これを下抜けるとビットコインの価格は10,500ドルへ向けて下落するでしょう。

On the upside, there are many hurdles near the $11,500 and $11,600 levels. Moreover, there are two key bearish trend lines forming with resistance near $11,400 and $11,600 on the hourly chart of the BTC/USD pair. Therefore, a successful close above the $11,500 and $11,600 levels is needed for a fresh upward move.
上昇する場合は、11,500ドルと11,600ドル付近に多くのハードルがあります。さらに、BTC/USDペアの時間足チャートには、11,400ドルと11,600ドル付近でレジスタンスとなる重要な下降トレンドラインが2つ形成されています。そのため、新たに上昇を始めるには、11,500ドルと11,600ドル以上で引ける必要があります。
Looking at the chart, bitcoin price is clearly struggling to recover above the $11,600 resistance and the 100 hourly simple moving average. As long as there is no daily close above $11,600 and $11,800, there is a risk of more losses in the near term.
チャートを見ると、ビットコインの価格は明らかに11,600ドルのレジスタンスと100時間単純移動平均線を超える回復に苦戦しています。日足が11,600ドルと11,800ドル以上で引けない限り、近いうちにさらに下落する恐れがあります。
via: Bitcoin (BTC) Price Technical Bias Favors More Downsides
_


