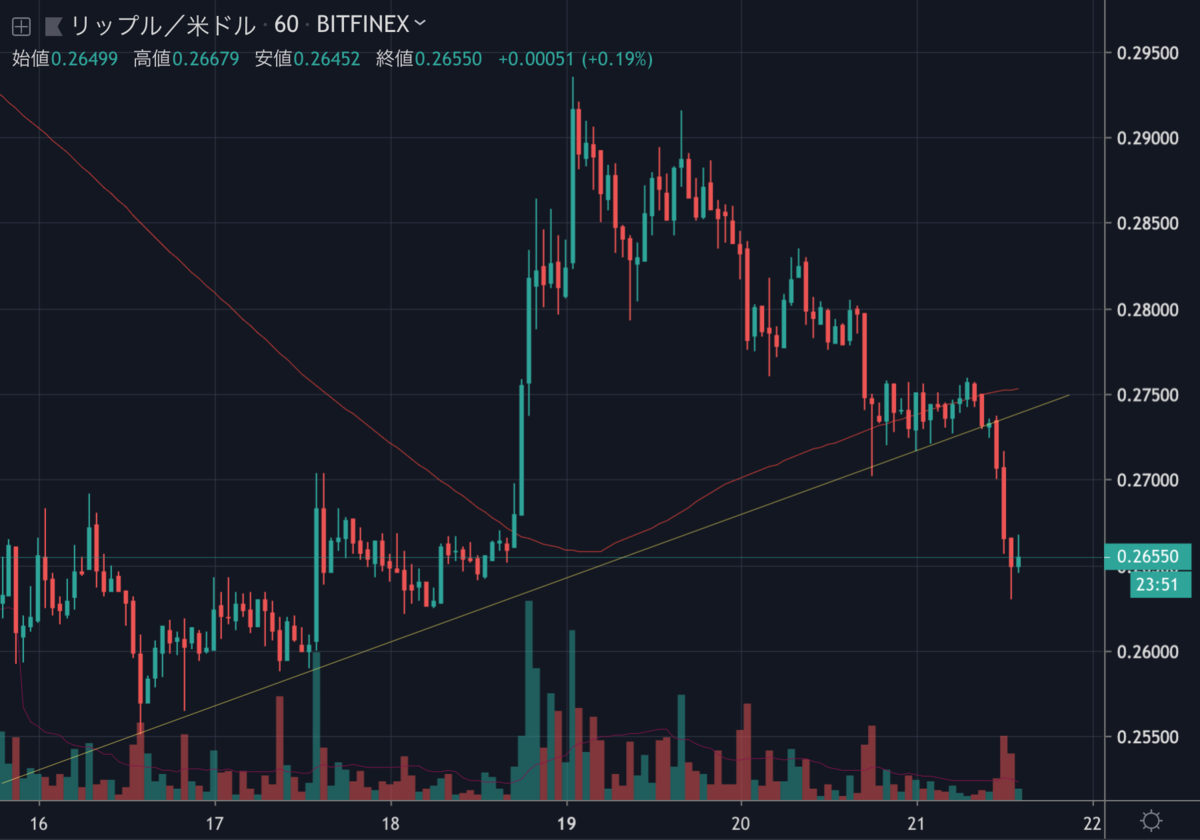
18日に急騰したリップル(XRP)は、再び下落を始め、サポートラインを下抜けました。

このまま下落を続けると、今月の安値を更新する可能性もありそうです。
XRPはまたしてもリップラーたちの心をへし折ってしまうのでしょうか。NEWS BTCのチャート分析を見てみます。
リップル(XRP)のチャート分析
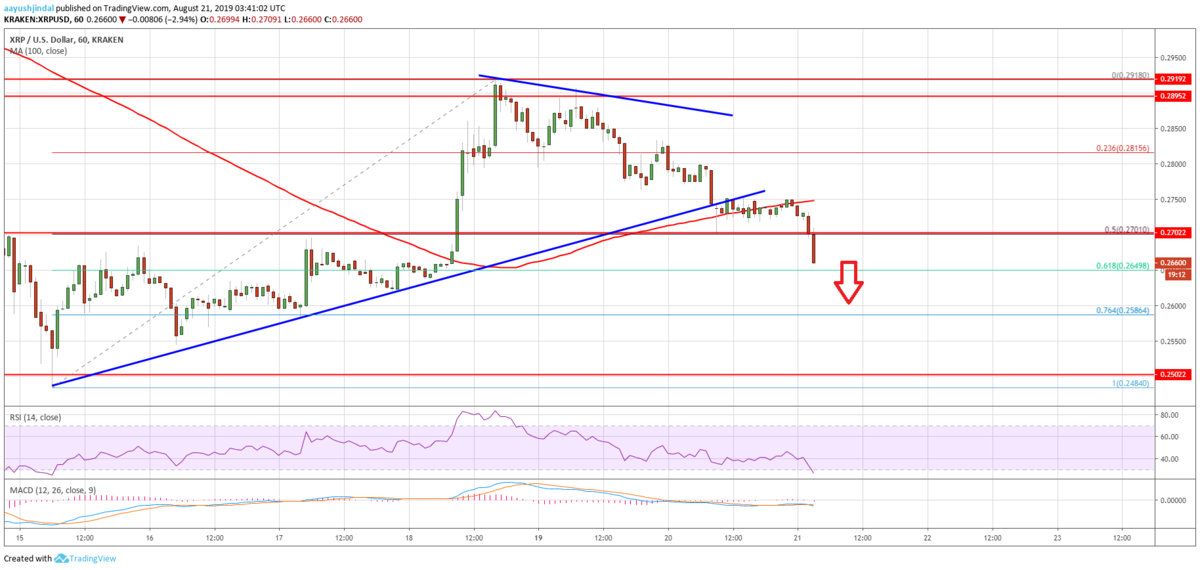
An immediate support is near the $0.2650 level. It represents the 61.8% Fib retracement level of the upward move from the $0.2484 low to $0.2918 high. If there are more downsides, the price could decline towards the $0.2600 support. Any further losses is likely to lead the price towards the next important support area near the $0.2500 level.
直近のサポートは0.265ドル付近。これは上昇の動き(0.2484ドル〜0.2918ドル)の61.8% Fibリトレースメントレベルになります。もし、今後さらに下落する場合、価格は0.26ドルのサポートに向かう可能性があります。さらに下落すると、価格は0.25ドル付近の次の重要なサポートエリアに向かう可能性が高いでしょう。

On the upside, the previous support near the $0.2700 level is likely to act as a resistance. Additionally, the 100 hourly simple moving average is near the $0.2750 level to prevent an upward move. Therefore, to start a fresh increase, the price must climb back above $0.2750 and the 100 hourly SMA.
上昇する場合、0.27ドル付近にあるこれまでのサポートがレジスタンスとして機能するでしょう。さらに、100時間SMA(単純移動平均線)が0.275ドル付近にあり、これも上昇を妨げます。そのため、再び上昇を始めるには、0.275ドルと100時間SMA以上まで回復する必要があります。
Looking at the chart, ripple price is facing an increase in selling pressure below the 100 hourly SMA and the $0.2700 support. If the bulls fail to protect the $0.2650 support, the price is likely to accelerate its decline. The next major support is near the $0.2500 level, below which the bears might target a fresh monthly low.
チャートを見ると、リップルの価格は100時間SMAおよび0.27ドルのサポート以下で、より一層の売り圧力に直面しています。0.265ドルのサポートが守られない場合、下落が加速する可能性が高いでしょう。次の重要なサポートは0.25ドル付近で、これを下抜けると月間の安値を更新する可能性があります。
via: Ripple Price (XRP) Breaks Key Support: More Downsides Likely
_


