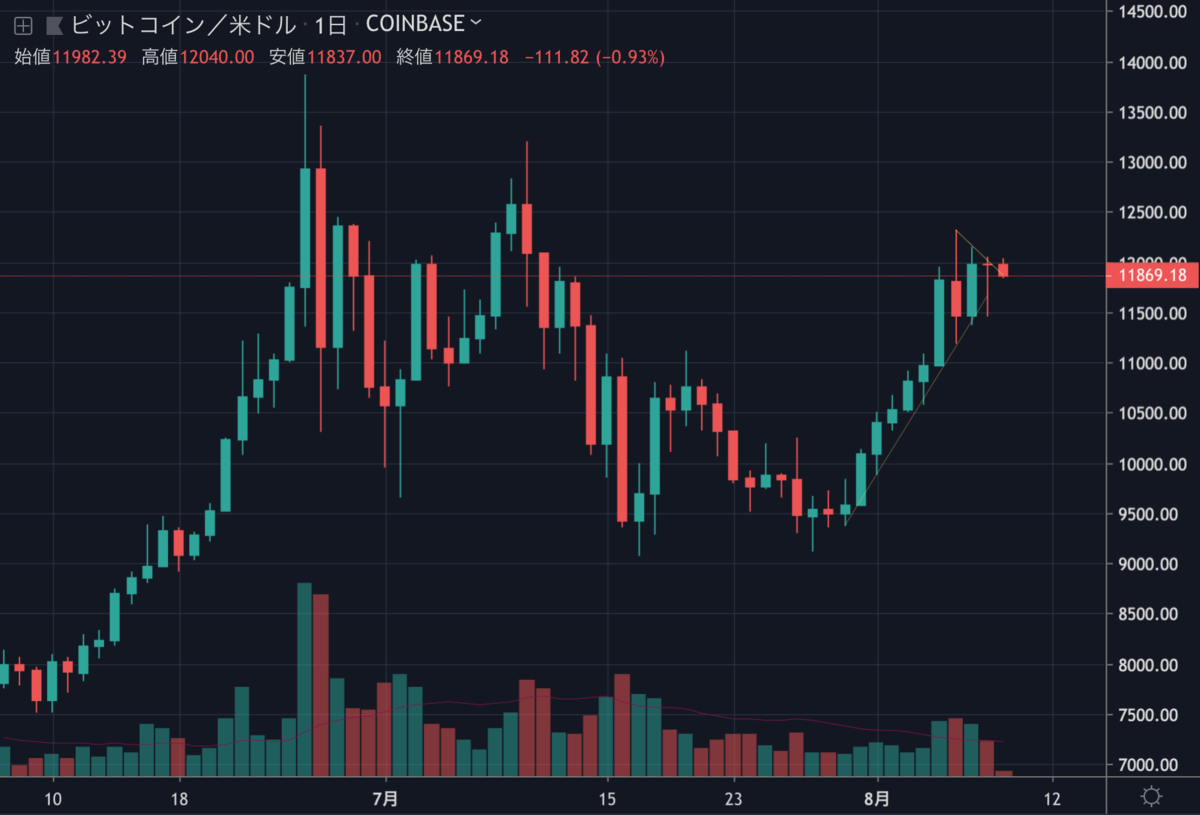
昨日12,000ドル付近まで上昇したビットコインは11,450ドル付近まで下落、その後も12,000ドルの突破を試みては押し戻される展開が続いています。

昨日のチャート分析では、12,000ドル以上で引ければ上昇トレンドが続く可能性があると予想されていましたが、現在は11,900ドル付近で停滞しています。
このまま下降トレンドに転換する可能性もあるのでしょうか。NEWS BTCのチャート分析を見てみます。
ビットコインのチャート分析
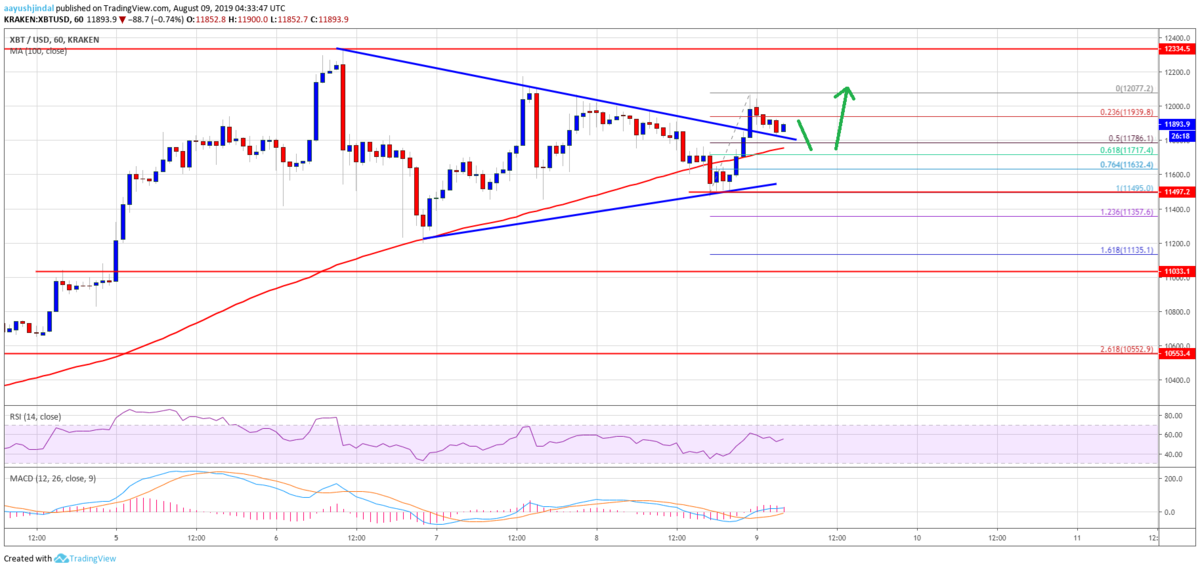
It traded below $12,000 plus the 23.6% Fib retracement level of the recent wave from the $11,495 low to $12,077 high. However, there is a strong support forming near the $11,750 level and the 100 hourly SMA. The 50% Fib retracement level of the recent wave from the $11,495 low to $12,077 high is also a decent support near the $11,786 level.
ビットコインは12,000ドル以下で取引され、さらに最近の波(11,495ドル〜12,077ドル)の23.6% Fibリトレースメントレベルも割り込んでいます。しかし、11,750ドル付近と100時間SMA(単純移動平均線)付近で強いサポートが形成されており、最近の波(11,495ドル〜12,077ドル)の50% Fibリトレースメントレベルも11,786ドル付近で強いサポートになります。

The main support on the downside is near the $11,500 level, below which the price could turn bearish in the near term. On the upside, there is a cluster of resistances near the $12,000 and $12,100 levels. Therefore, a successful close above $12,000 is needed for a sustained upward move.
下落時の主なサポートは11,500ドル付近。これを下回ると、近いうちに弱気に転じる可能性があります。上昇時は、12,000ドルと12,100ドル付近に複数のレジスタンスがあります。そのため、上昇を継続するには、12,000ドル以上で引ける必要があります。
Looking at the chart, bitcoin price is holding a couple of important supports near $11,750 and $11,700. Having said that, the price will only turn bearish in the short term if there is a daily close below $11,500. On the upside, the bulls could target $12,300 and $12,500.
チャートを見ると、ビットコインの価格には11,750ドルと11,700ドル付近に重要なサポートがいくつかあります。しかし、短期的には11,500ドル以下で引けると価格は弱気に転じるでしょう。上昇時は、12,300ドルと12,500ドルが目標になり得ます。
via: Bitcoin (BTC) Price Is Trading In Uptrend But Can Bulls Clear $12K?
_


