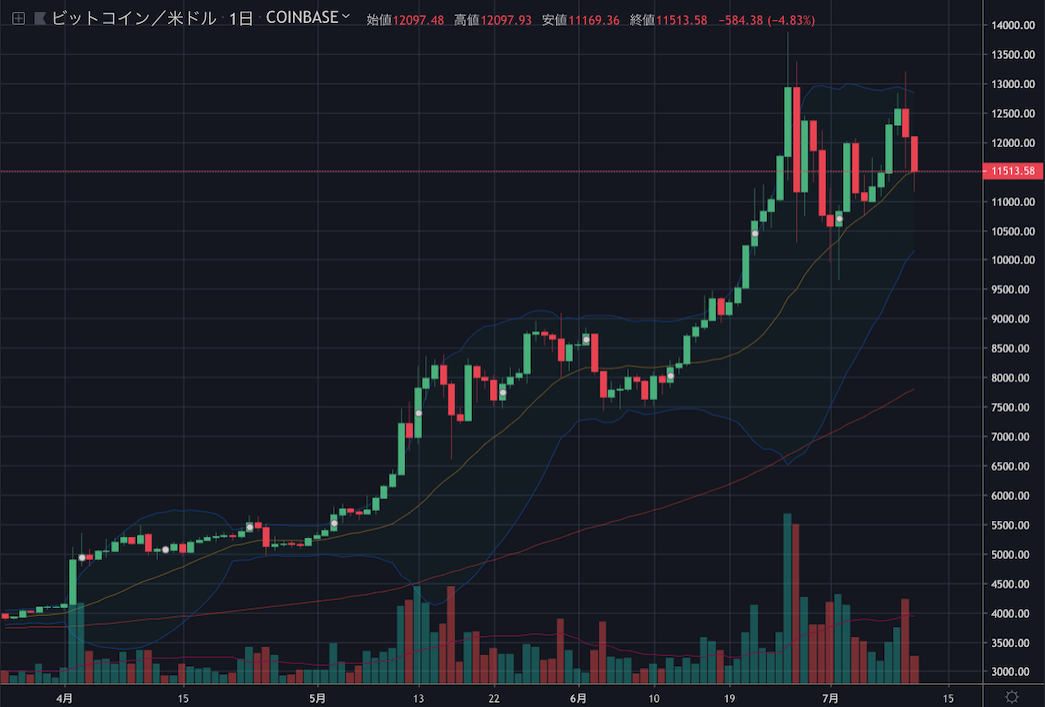
昨日1万3000ドル台まで回復したビットコインが再び急落し、記事執筆時点では1万1500ドル付近を推移しています。

日足チャートを見るとダブルトップを形成しつつあるように見えますが、今後の値動きはどうなるのでしょうか。NEWS BTCのチャート分析を見てみます。
ビットコインのチャート分析
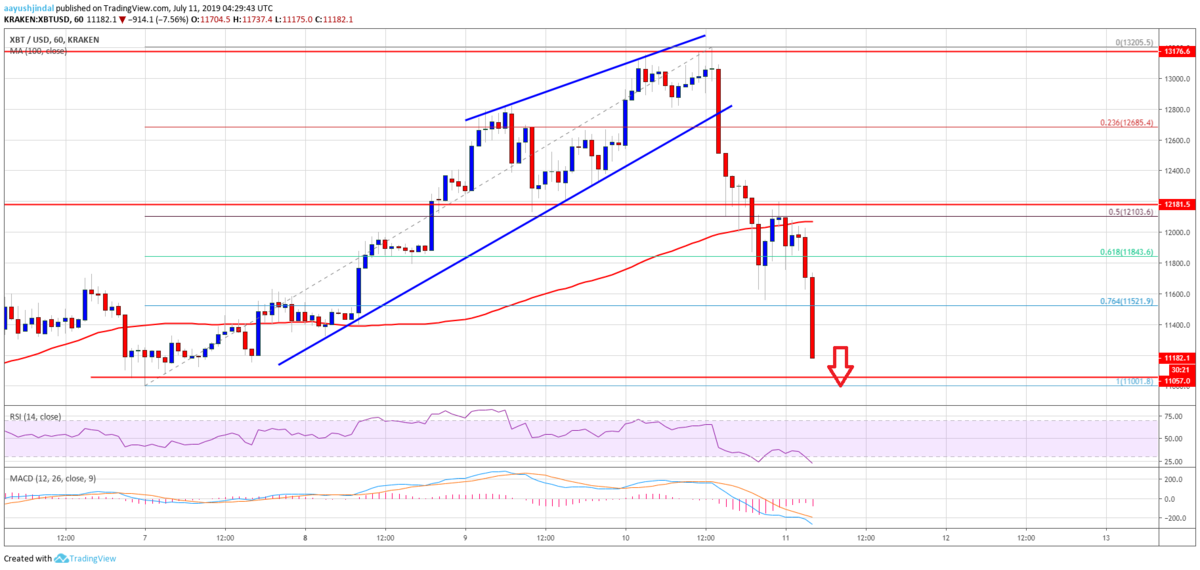
Yesterday, bitcoin price made a few attempts to settle above $13,000 against the US Dollar. However, the BTC/USD pair failed to gain momentum and recently started a sharp decline below $12,800 and $12,500.
昨日、ビットコインの価格は対ドルで1万3000ドル以上に留まろうとしたものの、BTC/USDペアは勢いを増すことができず、1万2800ドルと1万2500ドルを下回る急落を始めました。

Bitcoin is now trading well below the 76.4% Fib retracement level of the last major move from the $11,001 low to $13,200 high. Therefore, there are chances of more losses towards the $11,000 support area. The main support is near the $10,800 level, below which there is a risk of a drop towards the $10,500 level.
ビットコインは現在、最近の大きな動き(1万1001ドル〜1万3200ドル)の76.4% Fibリトレースメントレベルを大きく下回っています。そのため、1万1000ドルのサポートエリアへ向けてさらに損失が拡大する可能性があります。主なサポートは1万800ドル付近、これを下回ると1万500ドル付近まで下落するリスクがあります。
On the upside, an initial resistance is near the $11,500 level. If there is an upside correction, the price is likely to find hurdles near the $11,800 and $12,000 levels. The 100 hourly simple moving average is also likely to act as a strong barrier for the bulls near $12,000.
上側には最初のレジスタンスが1万1500ドル付近にあります。上方修正があれば、1万1800ドルと1万2000ドル付近がハードルになるでしょう。100時間単純移動平均線も1万2000ドル付近で強力な障害になる可能性があります。
Looking at the chart, bitcoin price clearly trimmed most its recent gains and settled below $12,000. It could find bids near the $11,000 or $10,800 level and it may start consolidating losses. Besides, there could be a short term upside correction towards $11,800 or even $12,000.
チャートを見ると、ビットコインの価格は明らかに最近の上げ幅を失い、1万2000ドルを割り込みました。1万1000ドルか1万800ドル付近で買いが入り、損失の整理が始まる可能性があります。また、短期的には1万1800ドルから1万2000ドルへの上方修正もあり得ます。
via: Bitcoin Price (BTC) Tumbles $2,000 In Few Hours: $10,800 Holds Key
_


