台風 7 号は本州を外れ日本海を北上中ですが、引き続き大雨に注意してください。ビットコインのチャート分析を見てみます。
仮想通貨の英語記事シリーズ、今回はこの記事を読んでいきます。
Bitcoin (BTC) Price Watch: Buyers Waiting on This Pullback
ビットコインのチャート分析
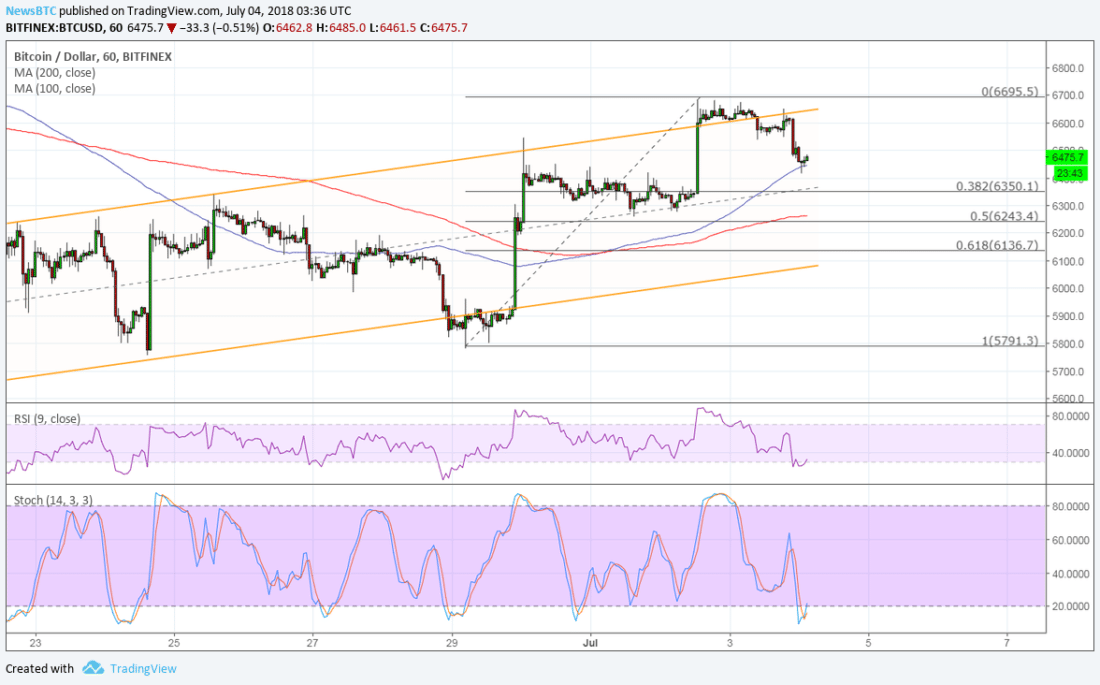
The 38.2% retracement level lines up with the mid-channel area of interest around $6,350 and the 200 SMA is closer to the 50% Fibonacci retracement level. The 61.8% Fib is just above the ascending channel support around $6,100 and might be the line in the sand for this short-term uptrend pullback.
38.2% リトレースメント水準は 6,350 ドル付近の中央チャネルエリアと並び、200 SMA (単純移動平均線) は 50% フィボナッチリトレースメント水準に接近しています。61.8% フィボナッチは 6,100 ドル付近の上昇チャネルサポートのすぐ上にあり、この押し目の防衛線になる可能性があります。

RSI has been on the move down to indicate the presence of selling pressure, but the oscillator is dipping into oversold territory and starting to pull up. Stochastic looks ready to head higher as well, hinting that buyers are eager to return.
RSI は下降して売り圧力の存在を示していますが、売られすぎ領域に入り上昇を開始しています。ストキャスティクスも上昇を始める準備に入り、買い方の復帰が予想されます。
If any of the Fib levels hold, bitcoin price could revisit the swing high near $6,700 or move higher.
いずれかのフィボナッチ水準が維持されれば、ビットコイン価格は 6,700 ドル近くまで回復するか、それ以上まで上昇する可能性があります。
_


