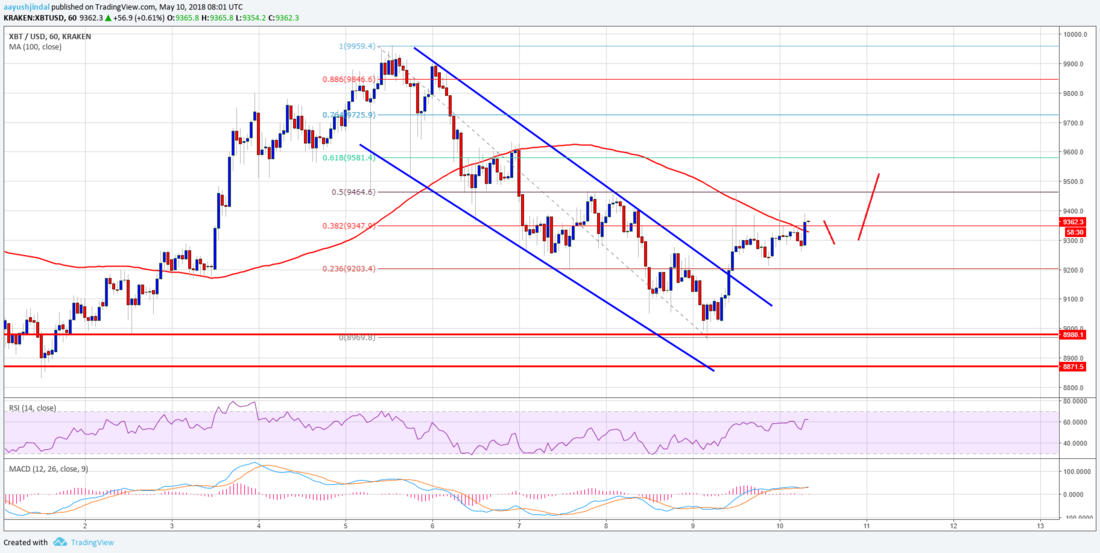
ゴールデンウィークが終わり、今週はビットコインが少し下落しています。ファンドストラット社のトム・リー氏は、来週のコンセンサス会議期間中に高騰すると予想していますが、チャート分析の解釈はどうなっているのでしょうか?
仮想通貨の英語記事シリーズ、今回はこの記事を読んでいきます。
Bitcoin Price Watch: BTC/USD Broke Key Barrier
ビットコインのチャート分析
After a downside correction, bitcoin price found a strong buying interest near the $9,000 level against the US Dollar. The price formed a low at $8,969 and started an upside move.
対ドルのビットコイン価格は、調整後に 9,000 ドル付近で強い買い意欲が見られました。価格は 8,969 ドルで安値を付け、そこから上昇が始まりました。
It climbed higher and cleared the 23.6% Fib retracement level of the last drop from the $9,959 high to $8,969 low. It opened the doors for more upsides and the price broke a couple of key hurdles near $9,180 and $9,200.
価格はそのまま上昇し、直近の下落 (9,959 ドルの高値から 8,969 ドルの安値まで) の 23.6% フィボナッチリトレースメント水準を突破しました。これにより、さらなる上昇の可能性が生まれ、9,180 ドルと 9,200 ドル付近にあるいくつかの重要なハードルを越えそうです。

Looking at the chart, there are many positive signs above the $9,200 support. As long as the price is stable and holds the bullish bias above $9,200, it is likely to break $9,450. The next stop for buyers could be $9,600 and $9,750.
チャートを見ると、9,200 ドルのサポートの上に多くのポジティブなサインがあります。価格が 9,200 ドル以上で安定し強気バイアスがある限り、9,450 ドルを突破する可能性は高いでしょう。買い方の次のストップは 9,600 ドルと 9,750 ドルになりそうです。
_


