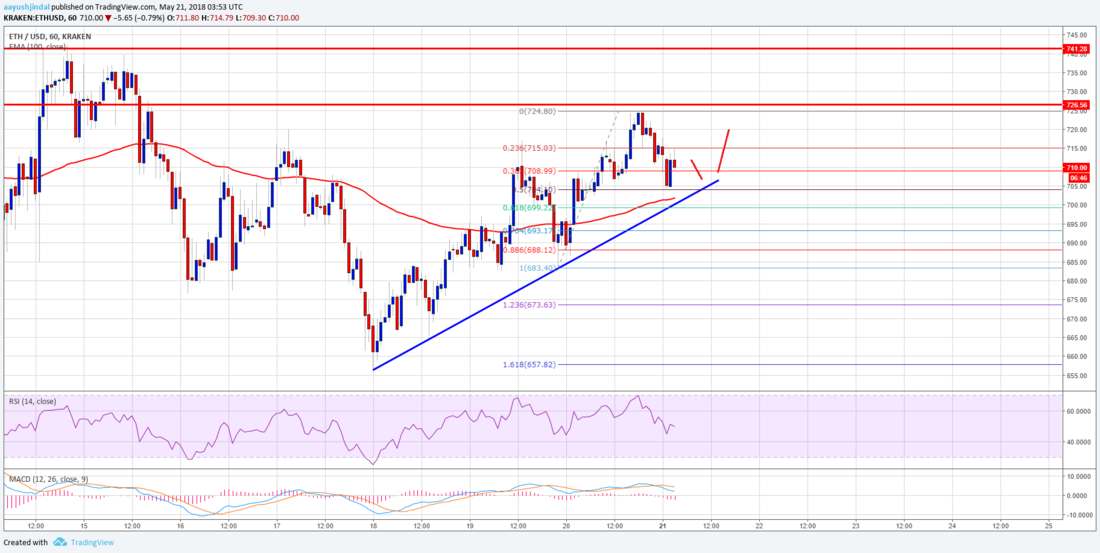
コンセンサス 2018 で仮想通貨が高騰するというトム・リー氏の予想に反して先週はかなり下落しましたが、今日は少し回復の兆しを見せているようです。イーサリアムのチャート分析を見てみます。
仮想通貨の英語記事シリーズ、今回はこの記事を読んでいきます。
Ethereum Price Analysis: Can ETH/USD Continue Higher?
イーサリアムのチャート分析
The past few sessions were mostly positive for ETH price as it moved above the $690 and $700 resistance levels against the US Dollar. The price even spiked above the $720 level, but it failed to extend gains towards $740. A high was formed at $724.80 before the price started a downside correction. It declined and moved below the $720 and $715 levels.
過去数回のセッションは ETH 価格にとって概ね良好となり、対ドルで 690 ドルと 700 ドルのレジスタンス水準を上抜けました。価格は 720 ドル水準さえも超えましたが、740 ドルまで伸ばすことはできませんでした。価格は 724.80 ドルで高値を付けた後調整を始め、720 ドルと 715 ドル水準以下まで下がりました。

During the decline, there was a break below the 23.6% Fib retracement level of the last wave from the $683.40 low to $724.80 high. However, there are many supports on the downside above the $700 level. There is also a key connecting bullish trend line formed with support at $704 on the hourly chart of ETH/USD.
下降中、直近の波 (683.40 ドルの安値から 724.80 ドルの高値まで) の 23.6% フィボナッチリトレースメント水準を下抜けました。しかし、700 ドル水準以下には多くのサポートがあります。また、ETH/USD の 1 時間足チャートには 704 ドル付近でサポートする重要な上昇トレンドラインがあります。
The same trend line is positioned near the 50% Fib retracement level of the last wave from the $683.40 low to $724.80 high. More importantly, the 100 hourly simple moving average is near $700-702. Therefore, the price is likely to find strong bids near the $700-704 zone.
同じトレンドラインは、直近の波 (683.40 ドルの安値から 724.80 ドルの高値まで) の 50% フィボナッチリトレースメント水準付近にもあります。さらに重要なのは、100 時間単純移動平均線が 700〜702 ドル付近にあることです。そのため、700〜704 ドル付近のゾーンで強い買いが入る可能性があります。
今回はイーサリアムのチャート分析に関する記事でした。
最近はニュースでも何かとイーサリアムの話題が多いので、チャート分析とあわせて期待して見守りたいです。
_


