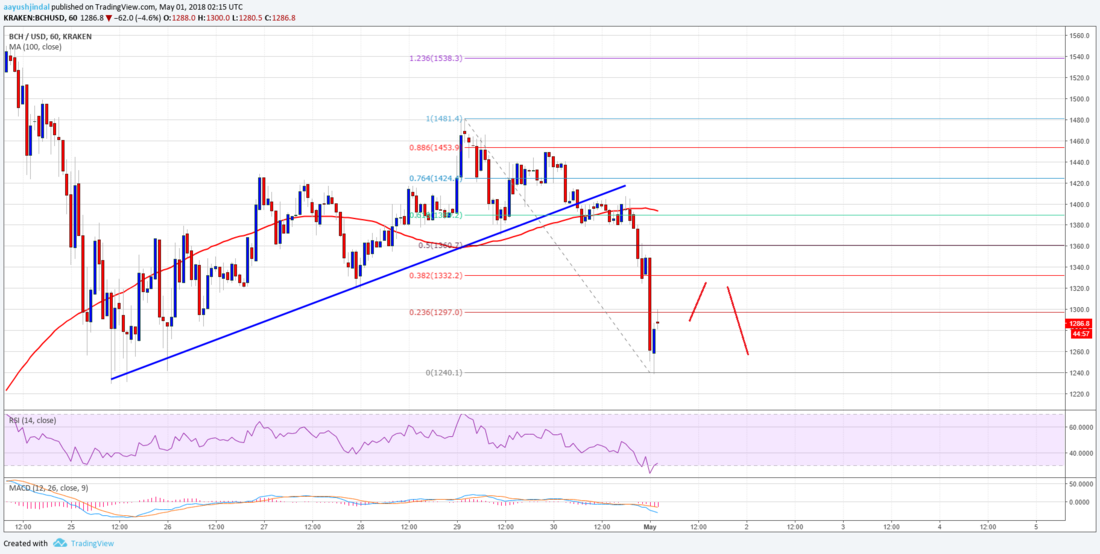
ビットコインが突然下落し、多くのアルトコインも連動するように価格を下げています。ビットコインキャッシュのチャート分析を見てみます。
仮想通貨の英語記事シリーズ、今回はこの記事を読んでいきます。
Bitcoin Cash Price Technical Analysis – BCH/USD Breaks Key Support
ビットコインキャッシュのチャート分析

The price started a fresh downside move and declined below the $1,420 support level. There was also a break below the 61.8% Fib retracement level of the last wave from the $1,235 low to $1,481 high.
(ビットコインキャッシュの) 価格は下落を始め、1,420 ドルのサポートレベルを下抜けました。また、1,235 ドルの安値から 1,481 ドルの高値の直近の波の 61.8% フィボナッチリトレースメント水準も下抜けました。
More importantly, there was a break below a key bullish trend line with support at $1,400 on the hourly chart of the BCH/USD pair.
さらに重要なことに、BCH/USD ペアの時間足チャートにおいて、1,400 ドルでサポートされる重要な上昇トレンドラインを下抜けました。
An initial resistance on the upside is near the 23.6% Fib retracement level of the last decline from the $1,481 high to $1,240 low. However, the previous support near $1,400 may perhaps act as a strong resistance on the upside.
上昇の最初の抵抗は、1,481 ドルの高値から 1,240 ドルの安値までの直近の下落の 23.6% フィボナッチリトレースメント水準付近になります。しかし、前回のサポートである 1,400 ドル付近が、上昇の強い抵抗として機能する可能性もあります。
Looking at the chart, the 100 hourly simple moving average is positioned at $1,405 to act as a barrier for buyers. On the downside, the $1,240 support holds a lot of importance. BCH should stay above $1,240 to avoid further losses in the short term.
チャートを見ると 100 時間単純移動平均が 1,405 ドルにあり、買い方の障害になっています。下側では 1,240 ドルのサポートが重要な意味を担っています。BCH が短期的にさらなる下落を免れるには、1,240 ドル以上を維持する必要があります。
_


