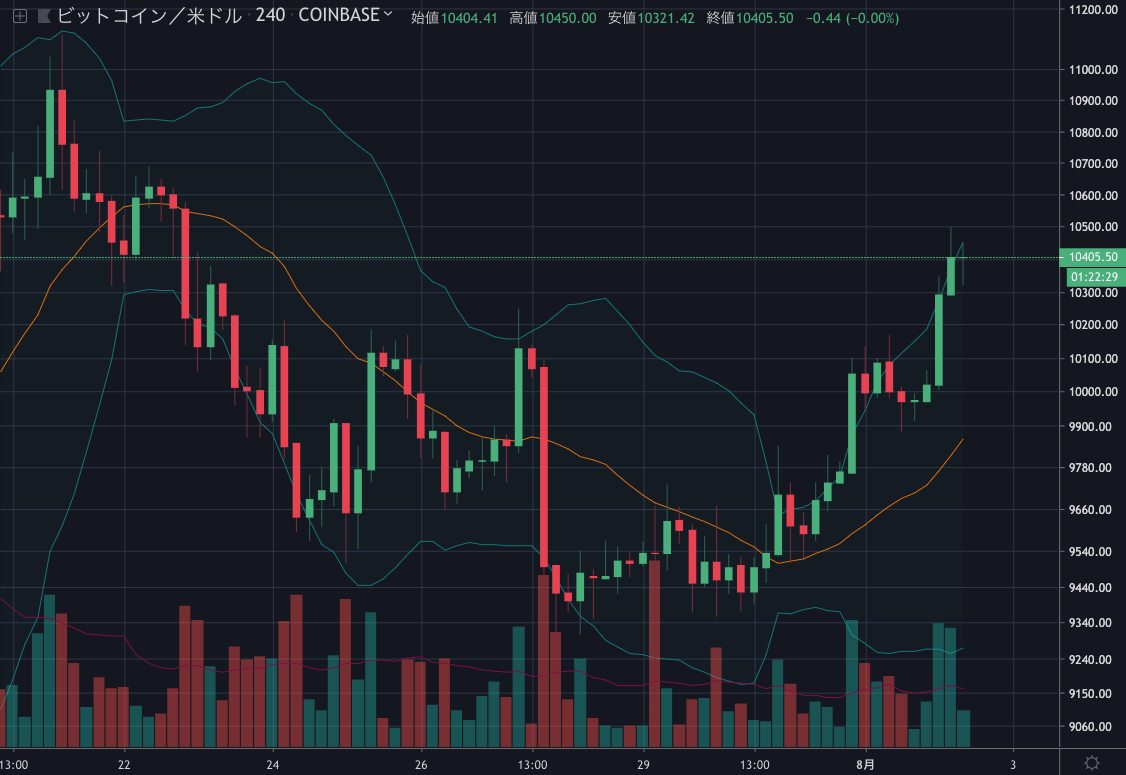
ビットコインは昨夜1万ドルを超えて急騰し、一時は10,200ドル付近まで上昇しました。その後は価格を戻し、記事執筆時点では9,900ドル付近で取引されています。
下落予想をするアナリストも多い中、ビットコインが上昇トレンドを継続する可能性はあるのでしょうか。NEWS BTCのチャート分析を見てみます。
[8/2 追記]
今朝10,400ドルを突破し、10,497ドルの高値を付けました(コインベース)。

ビットコインのチャート分析
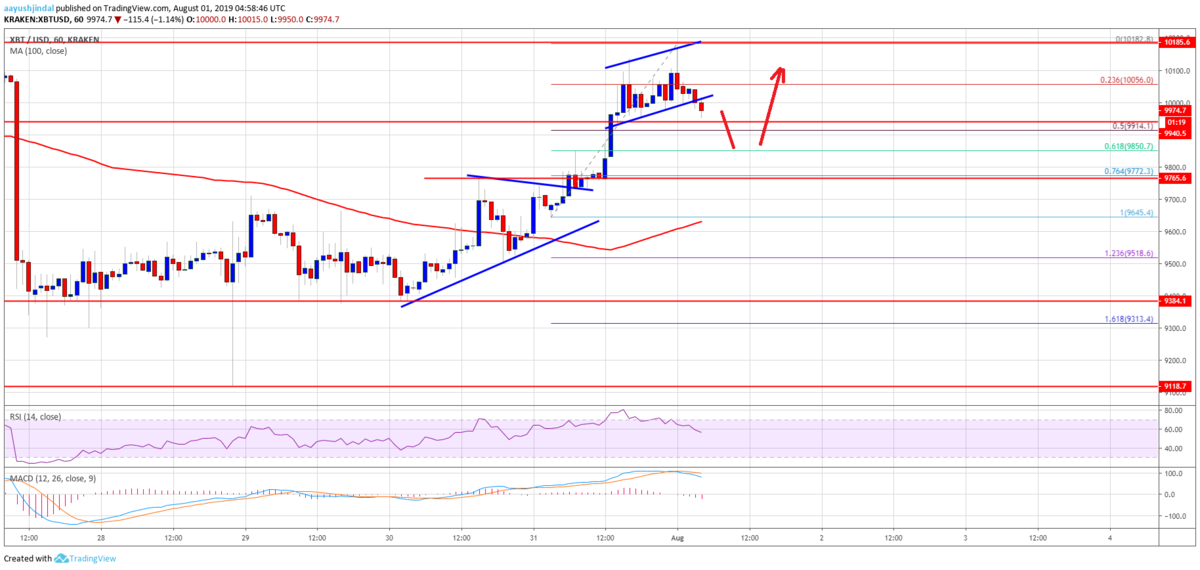
The main support is near the $9,850 level. If there is a downside break below the $9,850 support, the price could revisit the $9,650 level. The 100 hourly SMA is also waiting near the $9,640 level. Any further losses might push the price towards the $9,300 zone.
主なサポートは9,850ドル付近。これを下回れば、価格は再び9,650ドル付近まで下落する可能性があります。100時間SMA(単純移動平均線)も9,640ドル付近に控えています。さらに大きく下落する場合は、9,300ドル台まで下落するでしょう。

On the upside, an immediate resistance is near the $10,050 level, above which the price is likely to retest the $10,200 resistance level.
上昇する場合、直近のレジスタンスは10,050ドル付近。これを超えれば10,200ドルのレジスタンスを再び試す可能性が高くなります。
Looking at the chart, bitcoin price is clearly trading with a positive bias above the $9,900 and $9,850 levels. Conversely, if there is a fresh decline, the bulls are likely to protect the $9,640 support level.
チャートを見ると、ビットコインの価格は明らかに9,900ドルと9,850ドルを超えてポジティブなバイアスで取引されています。下落する場合は、買い方が9,640ドルのサポートを守る可能性が高いでしょう。
On the upside, a clear break above $10,200 will most likely set the pace for a move towards $10,500.
上昇時は、10,200ドルをはっきりと上抜けることで、10,500ドルへ向けて上昇する可能性が高くなります。
via: Bitcoin Price (BTC/USD) Correcting Gains, Dips Remain Supported
_


