ビットコインは引き続き三角保ち合いの範囲内で取引され、ブレイクが迫っていると予想するアナリストもいます。
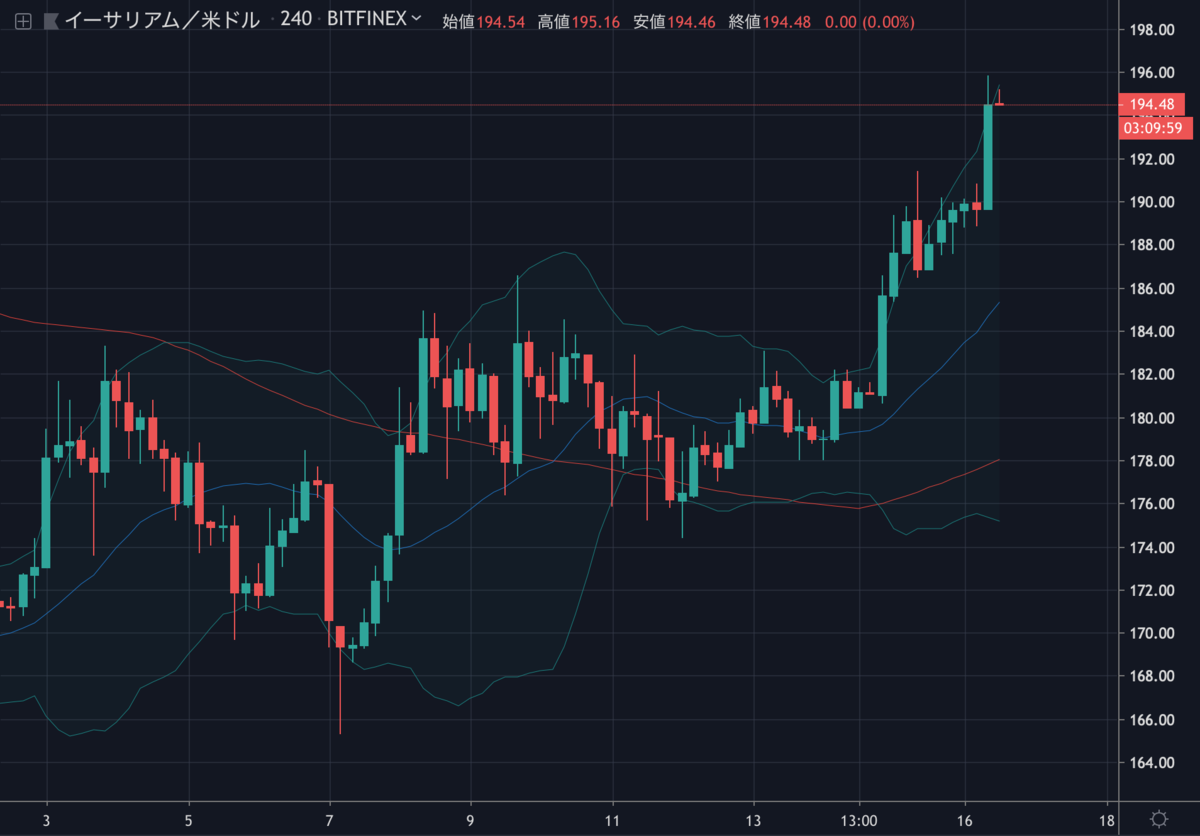
一方、イーサリアム(ETH)はここ数日間上昇しており、今後のさらなる上昇が期待されています。

ビットコインもETHに続き上昇する可能性はあるのでしょうか。
NEWS BTCのチャート分析を見てみます。
ビットコインのチャート分析
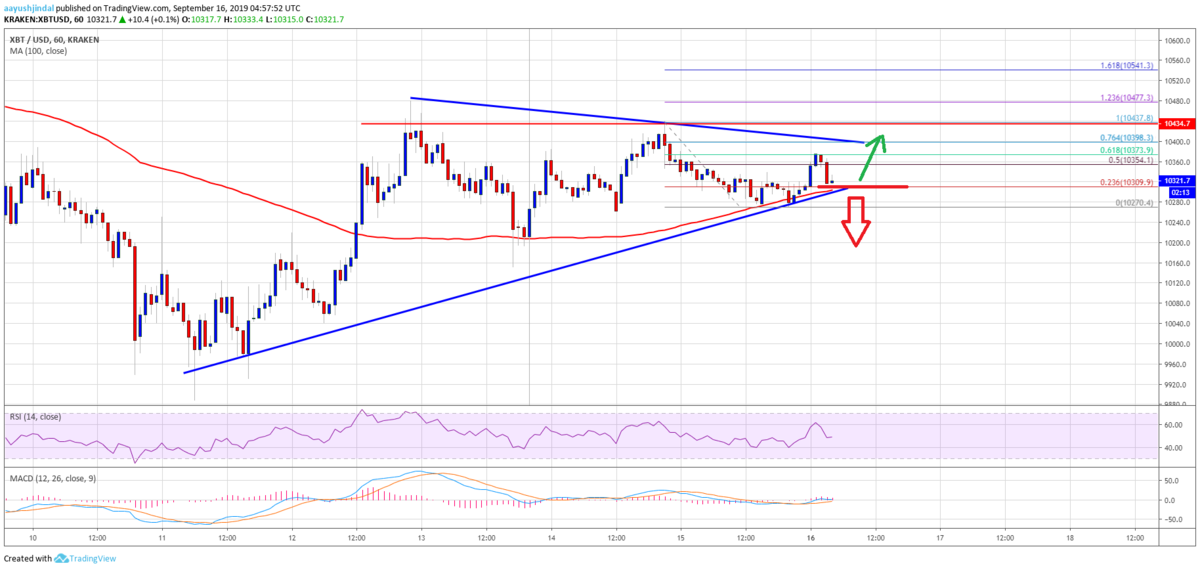
If bitcoin breaks the trend line support near $10,300 and the 100 hourly SMA, there could be a downside extension. An immediate support is near the $10,250 level, below which the price could head towards $10,000.
ビットコインが10,300ドル付近でサポートになっているトレンドラインと100時間SMA(単純移動平均線)を下抜ければ、さらに大きく下落する可能性があります。直近のサポートは10,250ドル付近、これを下回ると10,000ドルに向かう可能性があります。

Conversely, if there is an upside break above $10,400, the price could start another rise. The next major resistances are near $10,440 and $10,500. If the bulls remain in action above $10,500, the price could start a strong upward move above the $10,550 and $10,600 levels.
逆に、10,400ドルを突破すれば、価格は再び上昇を始める可能性があります。次の大きなレジスタンスは10,440ドルと10,500ドル付近になります。10,500ドル以上で維持されれば、10,550ドルと10,600ドルを超える強い上昇が始まる可能性があります。
Looking at the chart, bitcoin price is clearly preparing for the next break either above $10,400 or below $10,250. The current price action suggests that the price could rise steadily towards $10,500 as long as it is above the 100 hourly SMA. If not, there are chances of a fresh drop towards the $10,000 support area.
チャートを見ると、ビットコインの価格は明らかに次のブレイクに向けて準備されつつあり、10,400ドル以上または10,250ドル以下のどちらかに動きそうです。現在の値動きは、価格が100時間SMA以上にある限り、10,500ドルに向けて着実に上昇する可能性を示しています。そうでなければ、10,000ドルのサポートエリアに向けて下落を始める可能性があります。
via: Bitcoin Price (BTC) Approaching Next Break, $10,250 Holds Key
_


