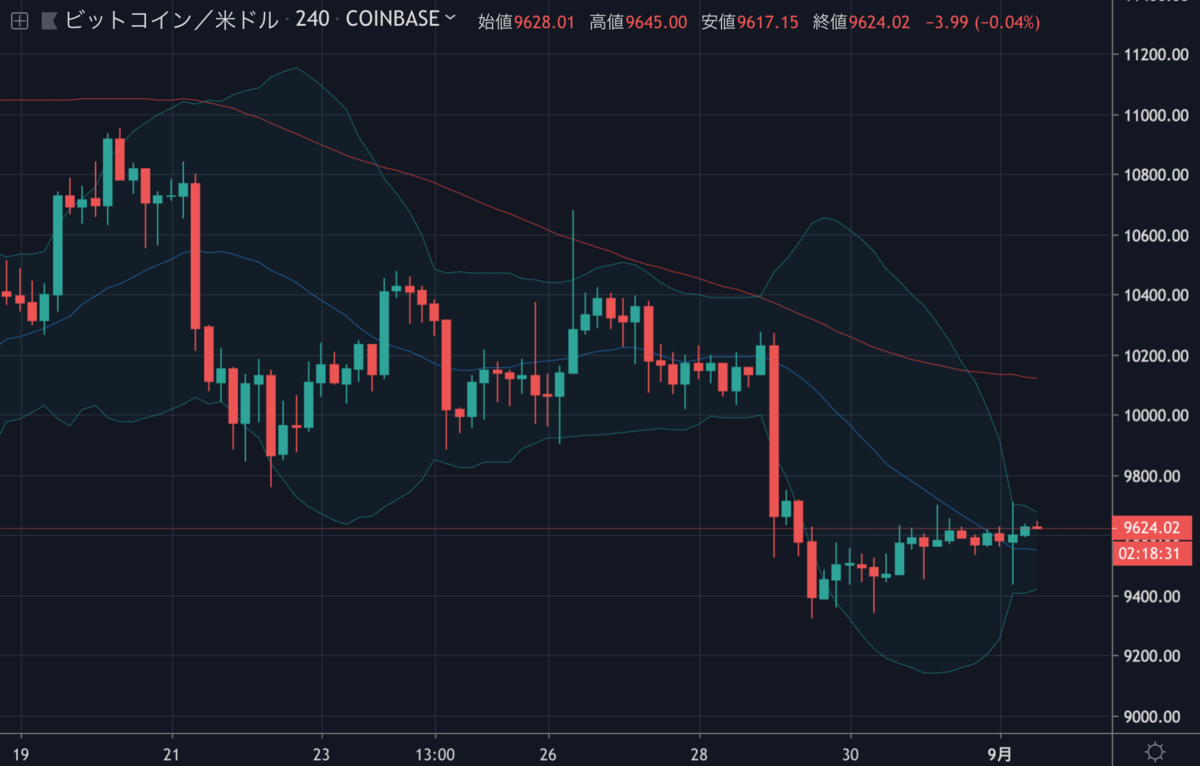
今週急落したビットコインは、9,400ドル付近で下げ止まり、その後わずかに回復しているように見えます。

ただし、上側にはレジスタンス(抵抗線)が多く控えているため、まだ苦戦を強いられそうな状況です。
NEWS BTCのチャート分析(週間予想)を見てみます。
ビットコインのチャート分析
In the last weekly forecast, we discussed the possibilities of a downward move below $10,000 in bitcoin price against the US Dollar. The BTC/USD pair did move down and broke the key $10,000 and $9,800 support levels.
前回の週間予想では、ビットコインの対ドル価格が10,000ドルを下回る可能性について議論しました。BTC/USDのペアは下落し、重要なサポートレベルである10,000ドルと9,800ドルを下抜けました。

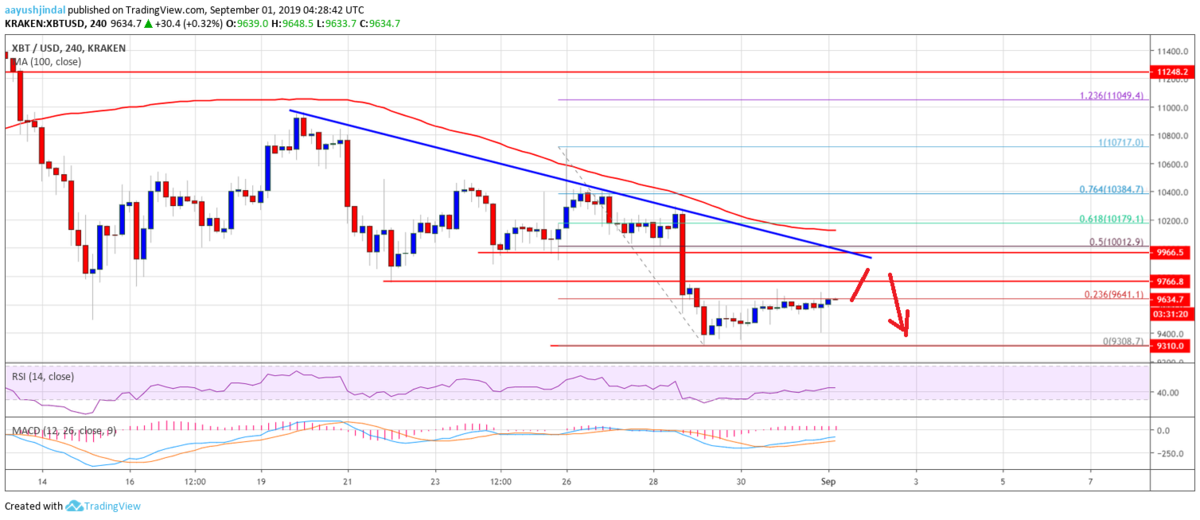
Additionally, there is a major bearish trend line forming with resistance near $9,980 on the 4-hours chart of the BTC/USD pair.
また、BTC/USDペアの4時間足チャートには、9,980ドル付近でレジスタンスになる大きな下降トレンドラインが形成されています。
Therefore, upsides are likely to remain capped near the $9,800 and $10,000 levels. Above the trend line, the 100 SMA is waiting near the $10,150 level.
そのため、引き続き9,800ドルと10,000ドル付近で上昇が抑えられる可能性が高いでしょう。トレンドラインの上には、100SMA(単純移動平均線)が10,150ドル付近に待ち構えています。
On the downside, an immediate support is near the $9,500 level. If there is a downside break below the $9,500 support, the price may continue to move down below the last swing low at $9,300. The next key supports are near the $9,100 and $9,000 levels.
下落する場合の直近のサポートは9,500ドル付近。9,500ドルのサポートを下抜けると、価格は下落を続け前回の安値9,300ドルを下回る可能性があります。次の重要なサポートは9,100ドルと9,000ドル付近になります。
via: Bitcoin (BTC) Price Weekly Forecast: $10K Holds Key For Recovery
_


