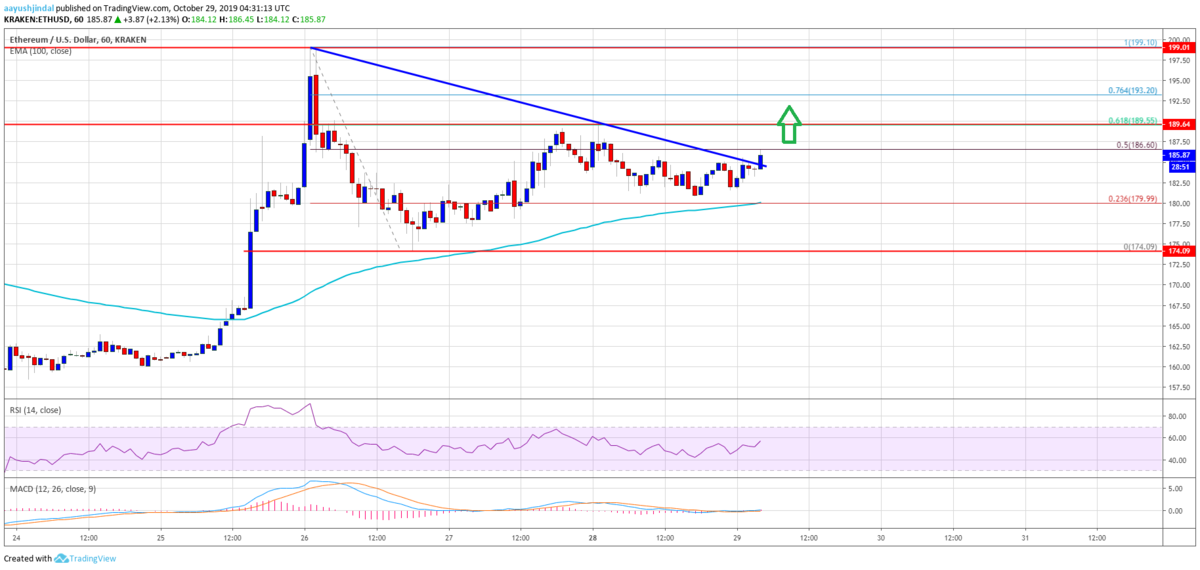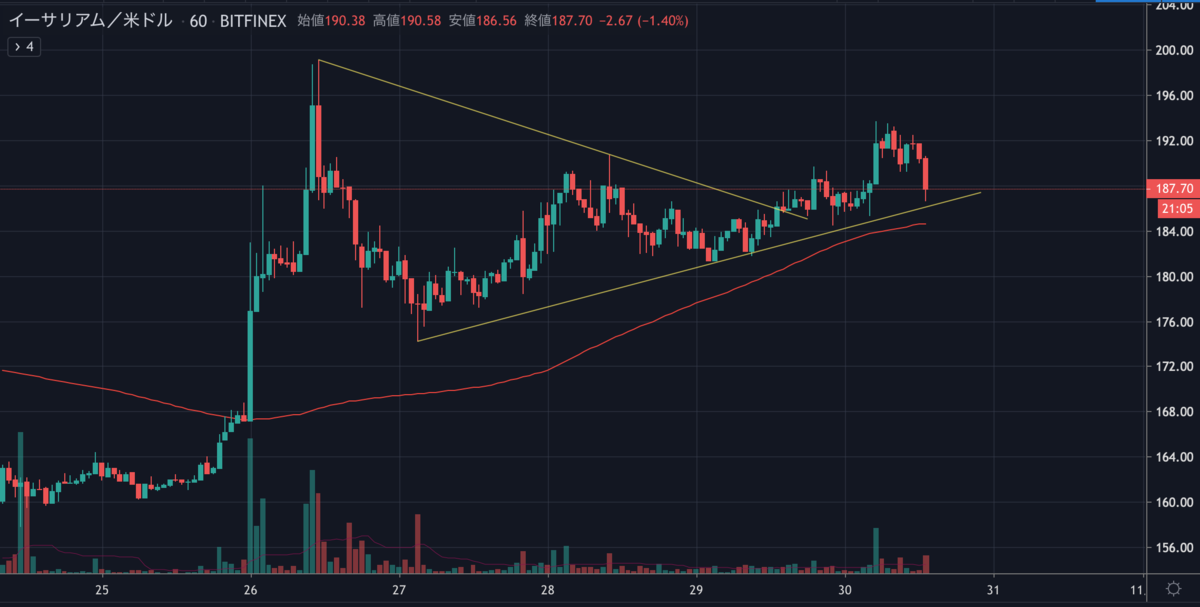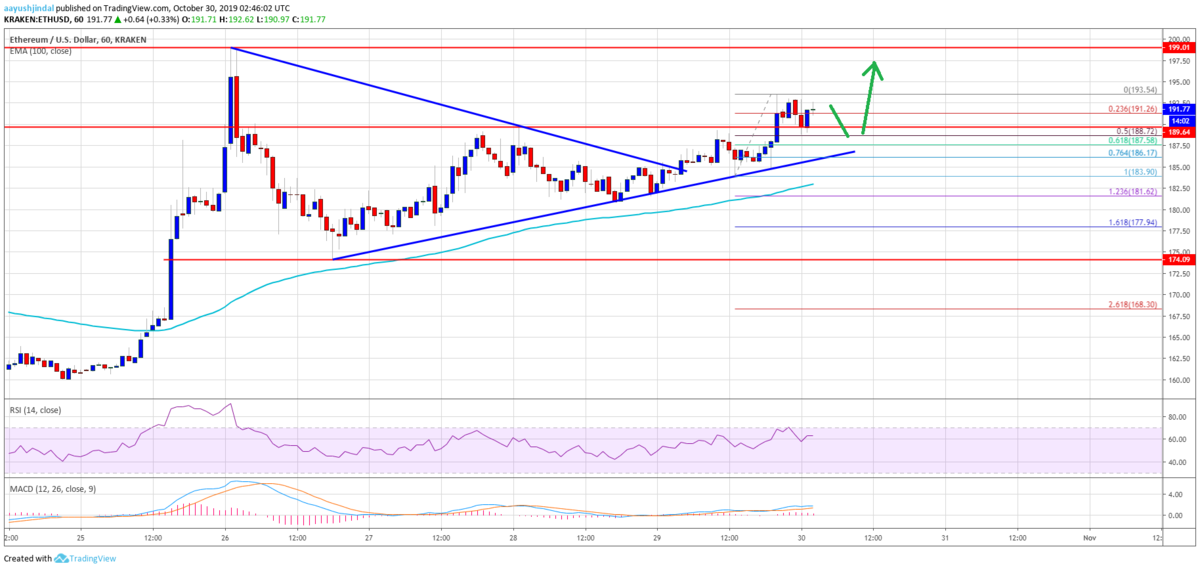
昨日のイーサリアムは三角保ち合いから上抜け、193ドル付近まで上昇しました。その後は価格を戻していますが、現在も上昇トレンドラインに支えられています。

Ethereum (ETH) Price Likely Setting Up For Next Rally

今後も上昇を続け、200ドルを突破する可能性はあるのでしょうか。
NEWS BTCでイーサリアムのチャート分析を見てみます。
イーサリアムのチャート分析
An immediate support is near the $188 level. Additionally, the 50% Fib retracement level of the recent wave from the $184 low to $193 high is also near the $188 level. More importantly, there is a new bullish trend line forming with support near $187 on the hourly chart of ETH/USD.
直近のサポートは188ドル付近。さらに、最近の波(184ドル〜193ドル)の50% Fibリトレースメントレベルも188ドル付近にあります。さらに重要なのは、ETH/USDの時間足チャートで、187ドル付近でサポートとなる上昇トレンドラインが新しく形成されていることです。

Therefore, a downside break below the $187 level might push Ethereum towards the $182 support area. The 100 hourly SMA is also near the $182 level to provide support.
そのため、187ドルを下抜けると182ドルのサポートエリアに向かう可能性があります。また、100時間SMA(単純移動平均線)も182ドル付近でサポートになっています。
On the upside, an immediate resistance is near the $195 level. A clear break above the $195 level could set the pace for more gains above the $198 and $200 resistance levels. If there are more upsides, the next stop for the bulls may perhaps be near the $205-$206 zone.
上昇時の直近のレジスタンスは195ドル付近。195ドルを大きく上回れば、198ドルと200ドルのレジスタンスを突破する可能性があります。さらに上昇する場合は、次の目標はおそらく205ドル〜206ドルゾーンになる可能性があります。
via: Ethereum (ETH) Gaining Momentum, $200 Seems Imminent
_


