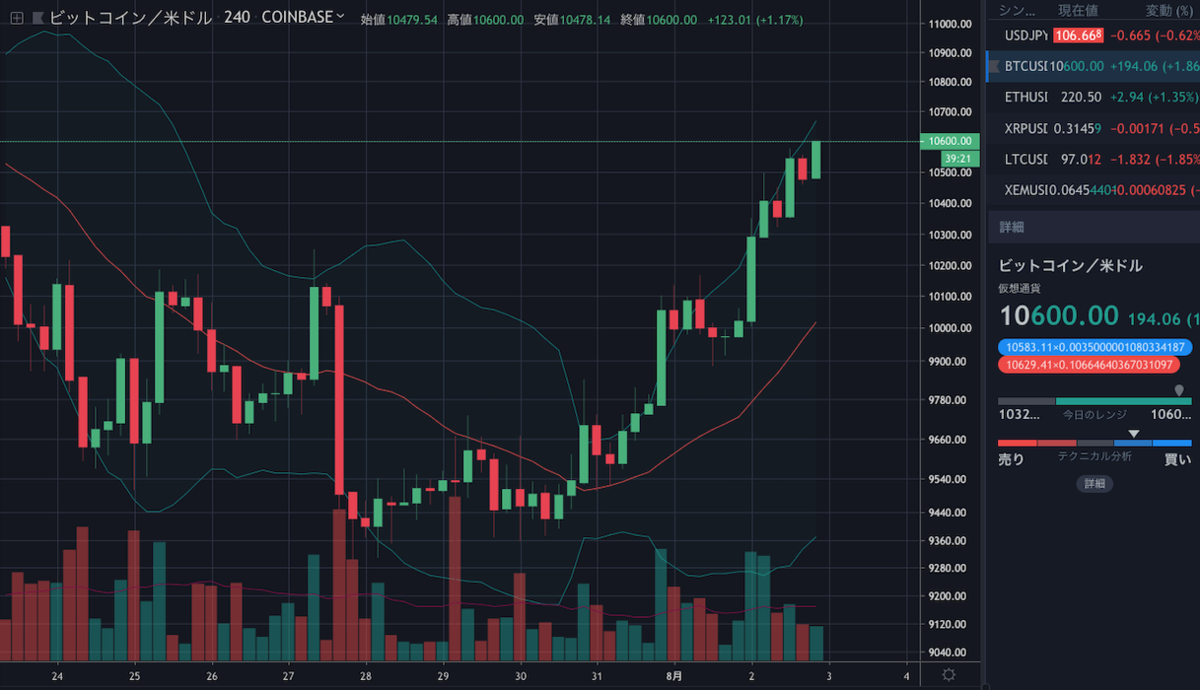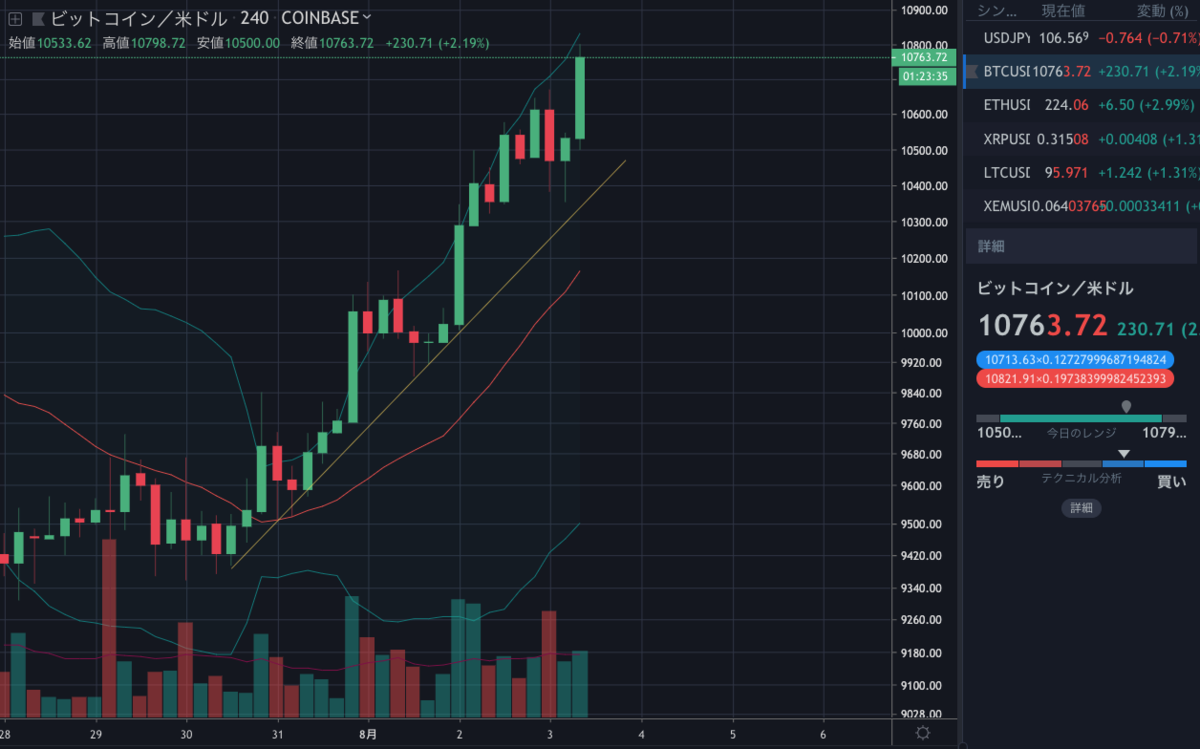
ビットコインの価格は2日朝に10,400ドルを超え、一時は10,500ドル付近まで上昇しました。
歴史的にビットコインは夏に下落しやすい傾向があるため未だ予断を許さない状況ですが、テクニカル的にはどのように判断できるのでしょうか。最近よく当たっているNEWS BTCのチャート分析を見てみます。
[8/3 0:20 追記]
10,600ドルに届きました。
最近のNEWS BTCの的中率はんぱないな・・・・・・。

[8/3 11:30 追記]
10,700ドルを突破。

ビットコインのチャート分析
If there is an upside break, the price is likely to accelerate above $10,450 and $10,500. The next key resistance is near the $10,600 level. On the downside, there is a strong support forming near the $10,200 level. Moreover, there is a major bullish trend line forming with support near $10,200 on the same chart.
もし(10,400ドルを)上抜ければ、価格の上昇は10,450と10,500ドルを超えて加速する可能性があります。次の重要なレジスタンスは10,600ドル付近になります。下落時は、10,200ドル付近に強いサポートがあります。さらに、同じチャート上に10,200ドル付近でサポートとなる大きな上昇トレンドラインが形成されています。

If there is a downside break below the $10,200 support, the price could revisit the $10,000 support area.
10,200ドルのサポートを下抜ける場合は、10,000ドルのサポートエリアまで再び下落する可能性があります。
Looking at the chart, bitcoin price is trading with a bullish bias above the $10,000 and $10,200 support levels. Therefore, there are high chances of more gains above the $10,500 and $10,600 levels in the coming sessions. Only a close below $10,000 might push the price back in a bearish zone.
チャートを見ると、ビットコインの価格は10,000ドルと10,200ドルのサポートを超えて強気バイアスで取引されています。そのため、今後は10,500ドルと10,600ドルを超えて上昇する可能性が十分に見込めます。10,000ドル以下で引ける場合に限り、弱気相場に戻る可能性があります。
via: Bitcoin Price (BTC/USD) Signaling Bullish Acceleration Above $10,500
_


