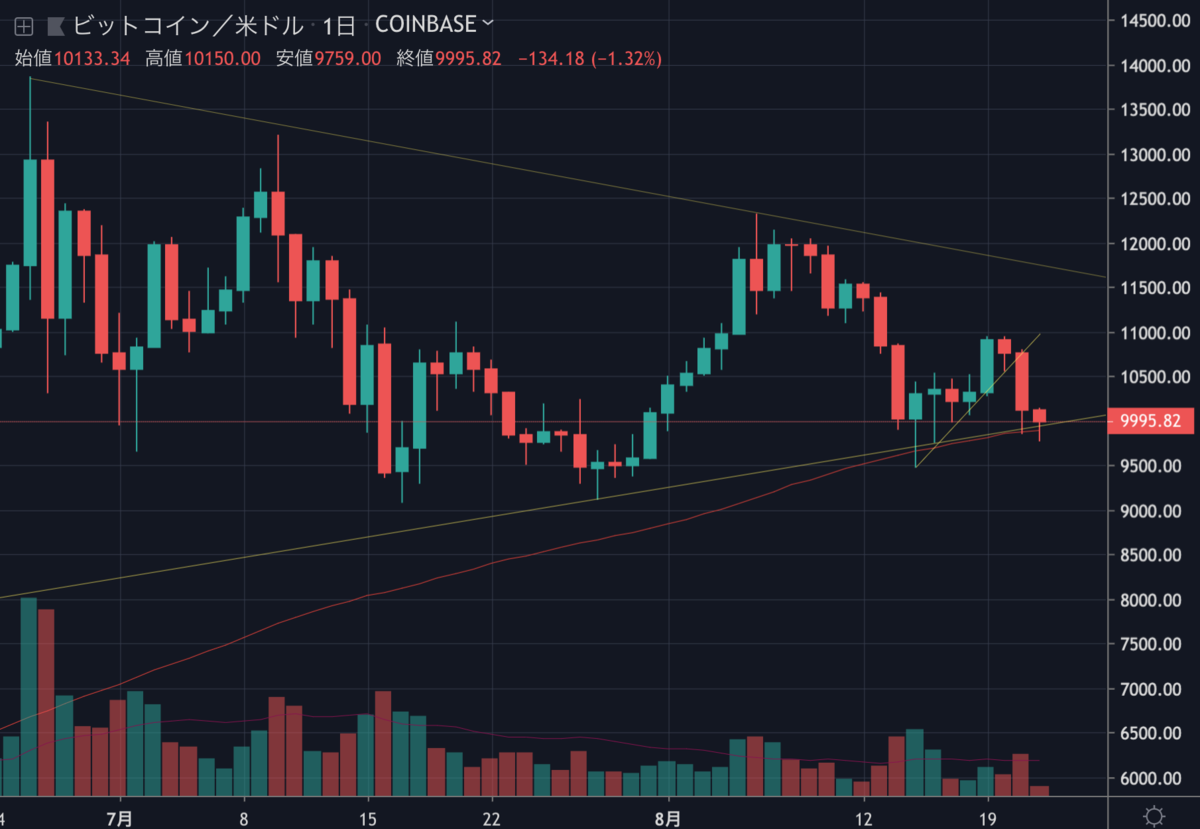
昨日のビットコインは短期のサポートラインを下抜け急落、再び10,000ドルを割り込みました。

現在は10,000ドル前後を行ったり来たりしていますが、ここを下抜けるとさらなる下落につながりそうです。NEWS BTCのチャート分析を見てみます。
ビットコインのチャート分析
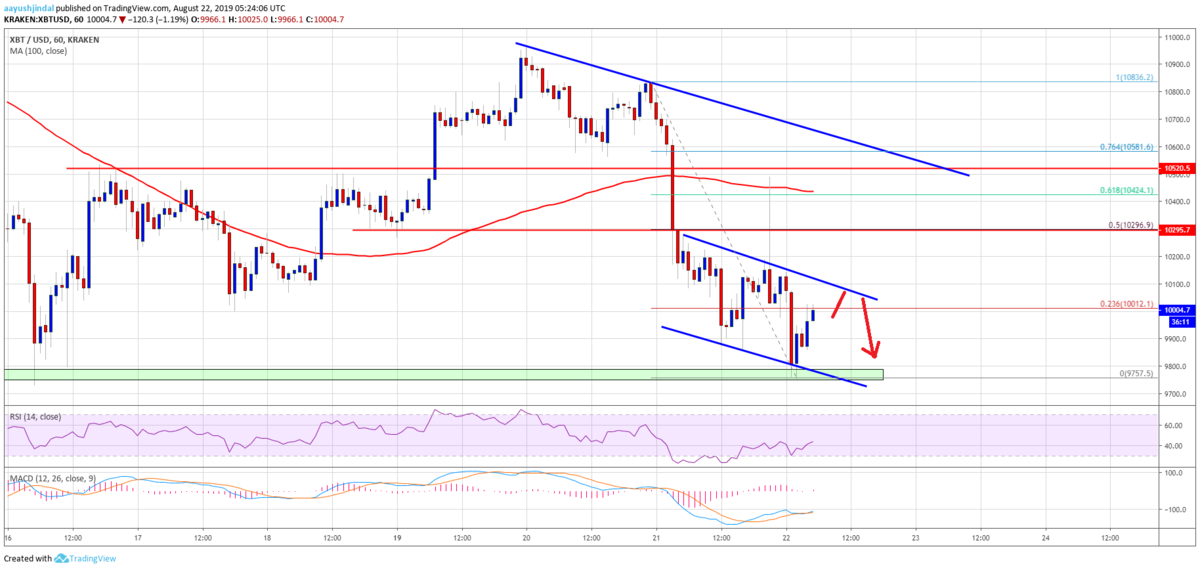
If there is an upside break above the channel resistance, the price could correct higher towards the $10,250 and $10,300 resistance levels. The 50% Fib retracement level of the recent decline from the $10,836 high to $9,757 low is also near the $10,296 level to act as a strong resistance. Therefore, an upside correction towards $10,100 or $10,250 is likely to face a strong resistance.
もしチャネルレジスタンスを上抜けるブレイクがあれば、価格は10,250ドルと10,300ドルのレジスタンスレベルへ向けて上昇する可能性があります。最近の下落(10,836ドル〜9,757ドル)の50% Fib リトレースメントレベルも10,296ドル付近で強いレジスタンスになります。そのため、10,100ドルまたは10,250ドルへ向けての上昇は、強いレジスタンスに直面する可能性が高いでしょう。

If the price fails to correct above the $10,100 resistance or the $10,250 barrier, it could resume its decline. An immediate support is near the $9,750 level, below which the bears are likely to target the $9,500 support area. Moreover, an intermediate support is near the $9,620 level.
10,100ドルや10,250ドルのレジスタンスが超えられなければ、再び下落が始まるでしょう。直近のサポートは9,750ドル付近、これを下抜けると9,500ドルのサポートエリアが目標になる可能性が高くなります。また、中間のサポートは9,620ドル付近になります。
Looking at the chart, bitcoin price is clearly back in a bearish zone, with a close below $10,250 and the 100 hourly SMA. Therefore, to start a fresh increase, the bulls need to gain strength above $10,250 and $10,300. The next major resistance is near the $10,500 level and a connecting bearish trend line on the same chart.
チャートを見ると、ビットコインの価格は明らかに弱気ゾーンに戻っており、終値は10,250ドルと100時間SMA(単純移動平均線)を下回っています。そのため、新たな上昇を開始するには、10,250ドルと10,300ドルを超える勢いが必要になります。次の主なレジスタンスは10,500ドル付近と下降トレンドラインになります。
via: Bitcoin (BTC) Price Target Additional Weakness, Upsides Remain Capped
_


