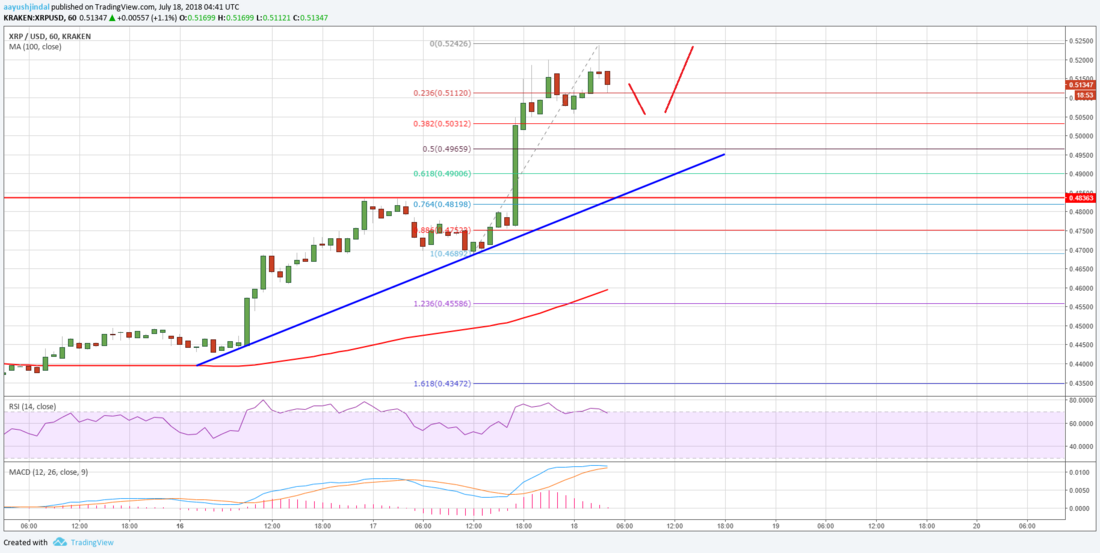
今日はビットコインが大きく高騰したため、それに連動してアルトコインも軒並み高騰しています。リップル (XRP) のチャート分析を見てみます。
仮想通貨の英語記事シリーズ、今回はこの記事を読んでいきます。
Ripple Price Analysis: XRP/USD Accelerating Above $0.5200
XRPのチャート分析
The XRP/USD pair climbed above a crucial resistance near $0.5000 to move into a bullish zone.
XRP/USD ペアは、0.5000 ドル付近の重要なレジスタンスを上抜け、強気ゾーンに突入しました。

Later, buyers were successful in pushing the price above the $0.5200 resistance which opened the doors for more gains. XRP price traded as high as $0.5242 before it started a downside correction.
その後、0.5200 ドルのレジスタンス突破も成功し、さらなる上昇の可能性が生じました。XRP 価格は 0.5242 ドルで取引され、その後は調整で下落しています。
There is also a major bullish trend line in place with support at $0.4920 on the hourly chart of the XRP/USD pair. Around the trend line support, the 50% Fib retracement level of the last wave from the $0.4689 low to $0.5242 high is positioned.
XRP/USD ペアの時間足チャートには、0.4920 ドルのサポートの位置に大きな上昇トレンドラインがあります。トレンドラインの近くには、直近の波 (0.4689〜0.5242 ドル) の 50% フィボナッチリトレースメント水準があります。
Therefore, if the price corrects lower, it is likely to find a lot of buying interest near the $0.5100 and $0.5000 levels.
そのため、価格が下落すれば 0.5100〜0.5000 ドル水準あたりで買いの関心が集まる可能性があります。
Looking at the chart, the price is showing many positive signs above $0.5000. On the upside, a break above the $0.5240-50 resistance zone may well push XRP towards the $0.5500 level in the near term.
チャートを見ると、価格は 0.5000 ドル以上で多くのポジティブなサインを出しています。0.5240〜0.5250 ドルのレジスタンスゾーンを上抜ければ、XRP は近いうちに 0.5500 ドル水準を目指す可能性があります。
_


