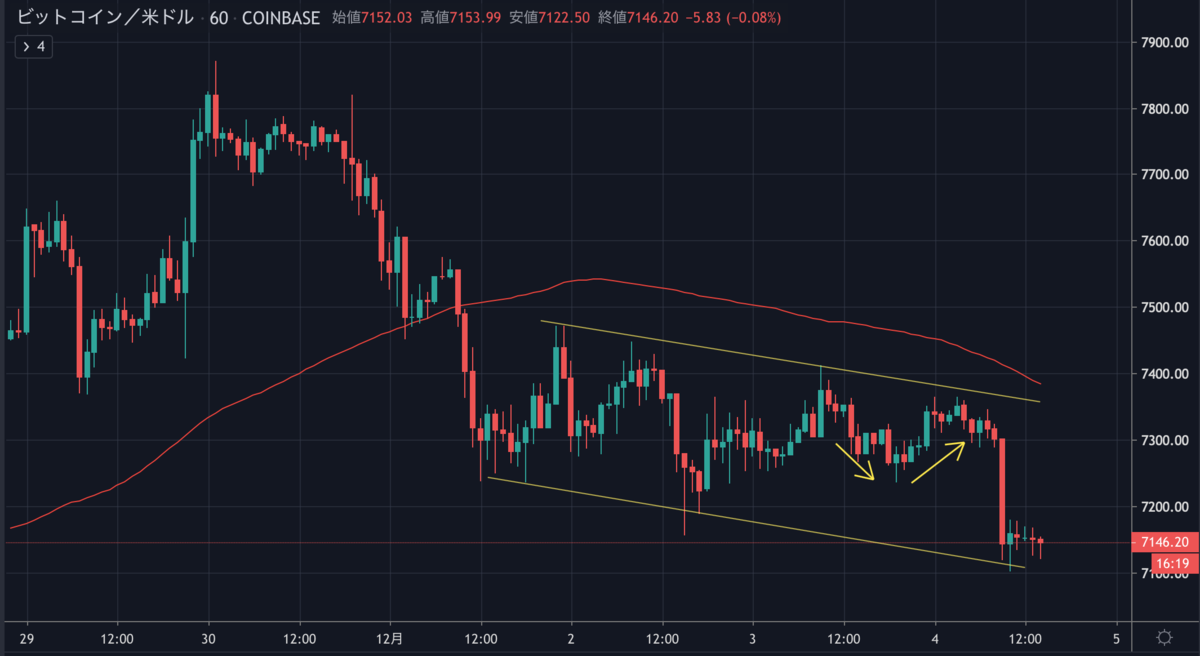
ビットコインが7,100ドル付近まで急落しました。
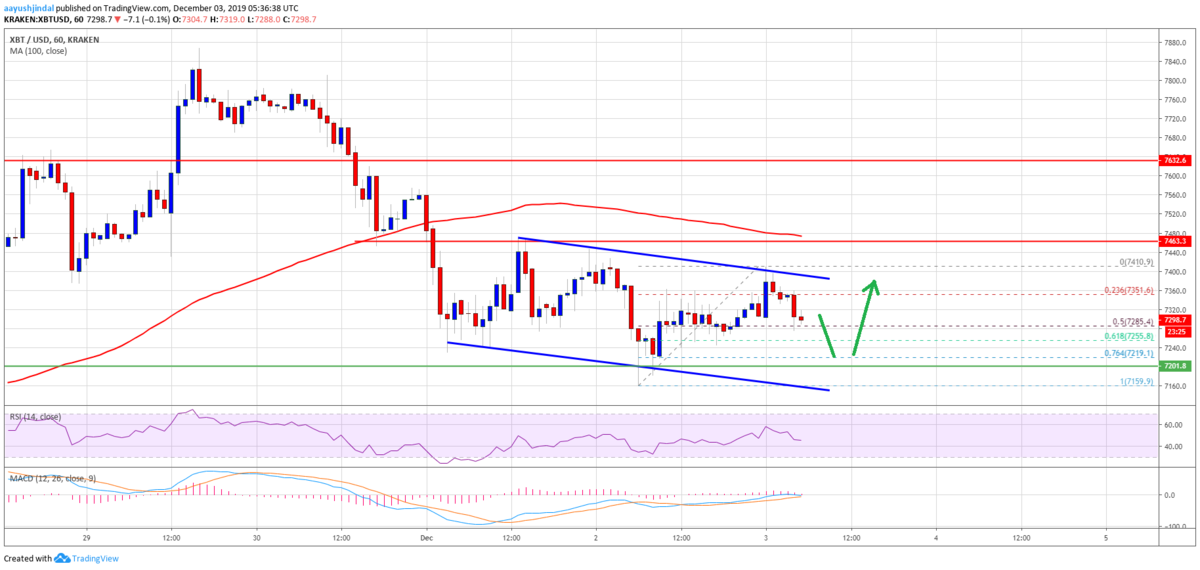
昨日のNEWS BTCの予想図は当たってなくもないぐらいの値動きでしょうか。下降チャネルを突破することはできませんでした。

Bitcoin (BTC) Relatively Muted, Signs of Further Weakness

ビットコインのチャート分析
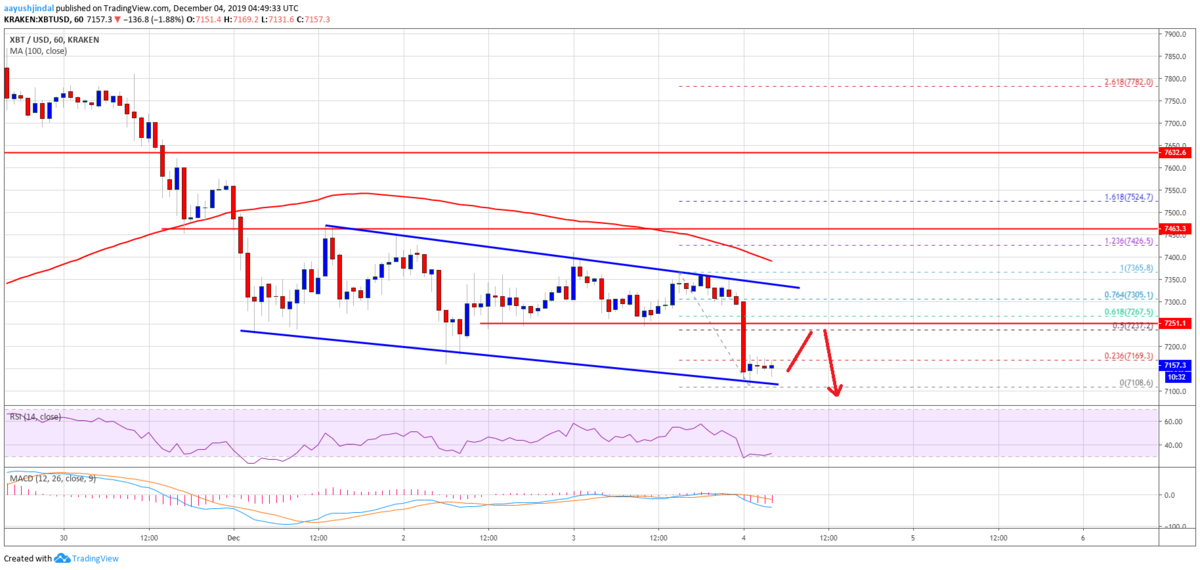
An immediate resistance is near $7,180, and the 23.6% Fib retracement level of the recent decline from the $7,365 high to $7,108 low.
目先のレジスタンスは7,180ドル付近、そして最近の下落(7,365ドル〜7,108ドル)の23.6% Fibリトレースメントレベルになります。

The main resistance on the upside is near the $7,240 level (the recent breakdown level).
上昇時のメインレジスタンスは7,240ドル付近(最近のブレイクダウン水準)です。
More importantly, yesterday’s key declining channel is still active with resistance near $7,320 on the hourly chart of the BTC/USD pair. Above the channel resistance, the main resistance is near the $7,400 level and the 100 hourly simple moving average.
さらに重要なのは、昨日の重要な下降チャネルはがまだ有効であり、BTC/USDペアの時間足チャートで7,320ドル付近でレジスタンスとなっていることです。このチャネルレジスタンスを上抜けると、メインレジスタンスは7,400ドルと100時間単純移動平均線付近になります。
Therefore, a daily close above the $7,400 barrier and the 100 hourly simple moving average is needed for a trend change. If not, bitcoin price is likely to decline further below $7,100.
そのため、上昇トレンドに転じるには、日足が7,400ドルと100時間単純移動平均線を超えて引ける必要があります。それができなければ、ビットコインの価格は7,100ドル以下まで下落する可能性が高いでしょう。
The next key support area is near the $7,000 level. If the bulls fail to defend the $7,000 support area, the price could start a nasty decline towards the last swing low near the $6,500 support area.
次の重要なサポートエリアは7,000ドル付近です。買い方が7,000ドルのサポートを守れなければ、6,500ドルのサポートエリアへ向けて急落する可能性があります。
via: Bitcoin (BTC) Trend Overwhelmingly Negative, Continue Selling?
_


