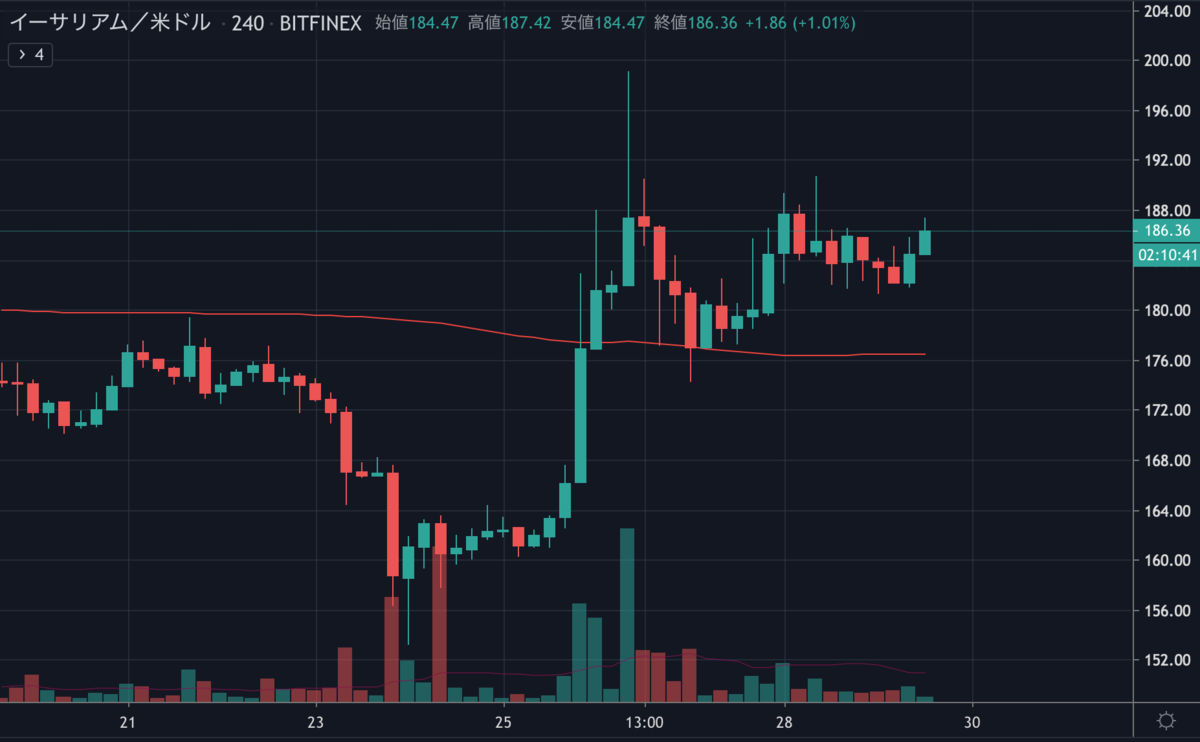
先日の暴騰以降、イーサリアムの価格はいったん下方修正し、現在は190ドル付近で上昇を抑えられつつもみ合っています。

チャートを見るとアセンディングトライアングルのような形になっていますが、今後の値動きはどのように予想されるのでしょうか。
NEWS BTCでイーサリアムのチャート分析を見てみます。
イーサリアムのチャート分析
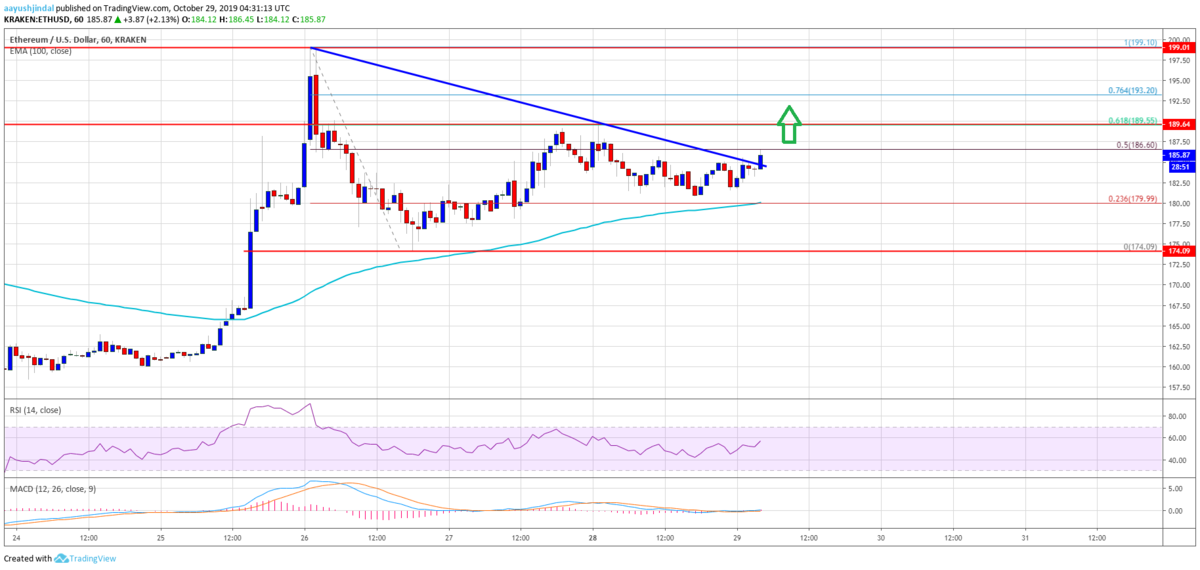
An immediate resistance is near the $186 and $188 levels. More importantly, the 61.8% Fib retracement level of the downside correction from the $199 high to $174 low is near the $190 level to stop the upward move.
直近のレジスタンスは、186ドルと188ドル付近です。さらに重要なのは、下方調整(199ドル〜174ドル)の61.8% Fibリトレースメントレベルが、上昇を止める190ドル付近にあることです。

Therefore, Ethereum must surpass the $188 and $190 resistance levels to continue higher in the near term. The next major resistance is near the $195 level, above which the price could revisit the $200 handle.
したがって、イーサリアムが短期的に上昇を継続するためには、188ドルおよび190ドルのレジスタンスを突破する必要があります。次の強いレジスタンスは195ドル付近で、これを上抜けると200ドルに戻る可能性があります。
On the downside, there is a strong support forming near the $180 level and the 100 hourly SMA. If there is a bearish break below the $180 support, the price could decline towards the $175 support. Any further losses may perhaps lead the price towards the $170 pivot level.
下落時は、180ドルと100時間SMA付近に強いサポートが形成されています。180ドルのサポートを下抜けると、価格は175ドルのサポートに向けて下落する可能性があります。さらにこれを下抜けると、価格は170ドルまで下落するかもしれません。
Looking at the chart, Ethereum price is showing a lot of positive signs above the $180 support area. A convincing close above the $188 and $190 resistance levels could set the pace for another rally towards the $200 area. If no, there is a risk of an extended downside correction towards the $170 zone.
チャートを見ると、イーサリアムの価格は、180ドルのサポートエリア以上で多くのポジティブサインを示しています。188ドルと190ドルのレジスタンスレベルをはっきりと上抜けて引ければ、200ドルエリアへ向けて上昇が加速する可能性があります。それができなければ、170ドルゾーンに向けて下方修正を拡大する恐れがあります。
via: Ethereum (ETH) Price Likely Setting Up For Next Rally
_


