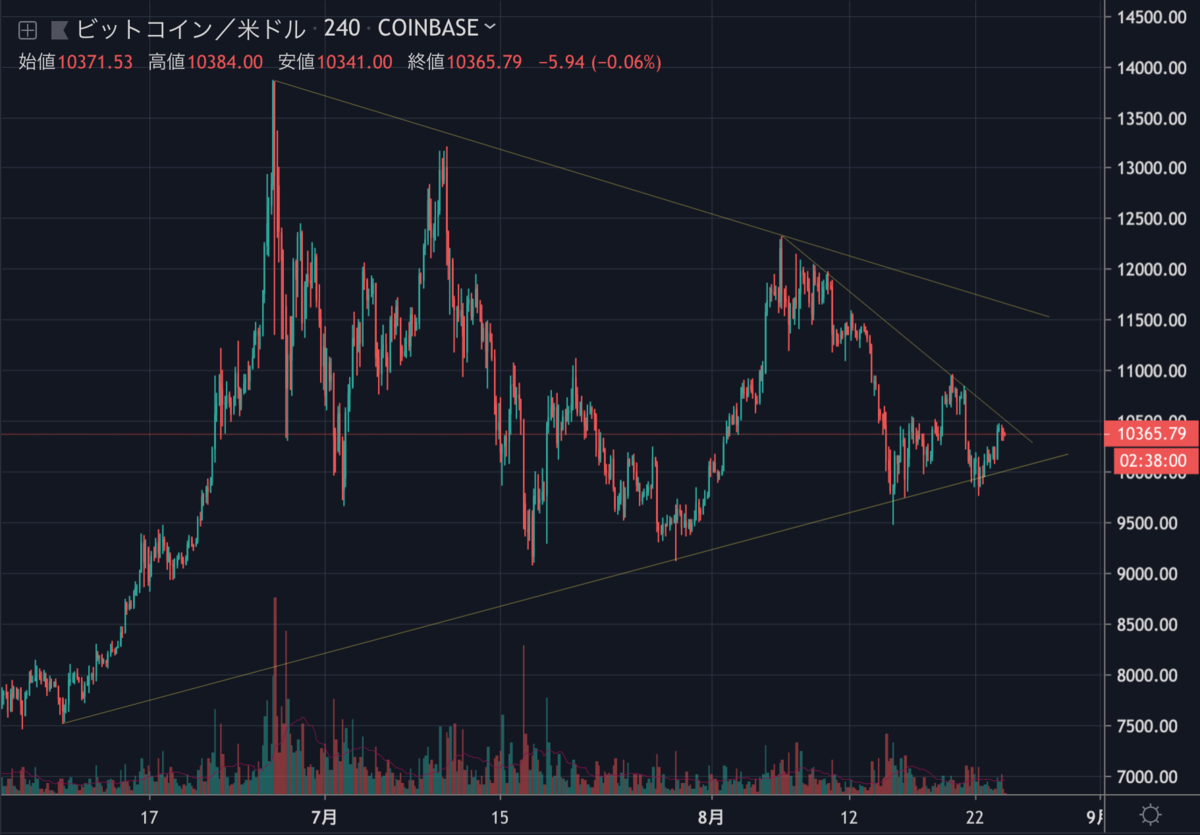
今週急落したビットコインは、一時は1万ドルを割り込んだものの、現在は少し回復して10,300ドル付近で取引されています。

三角保ち合いをどちらかにブレイクすれば大きく動き出しそうな状況ですが、今後の値動きはどのように予想されるのでしょうか。NEWS BTCのチャート分析を見てみます。
ビットコインのチャート分析
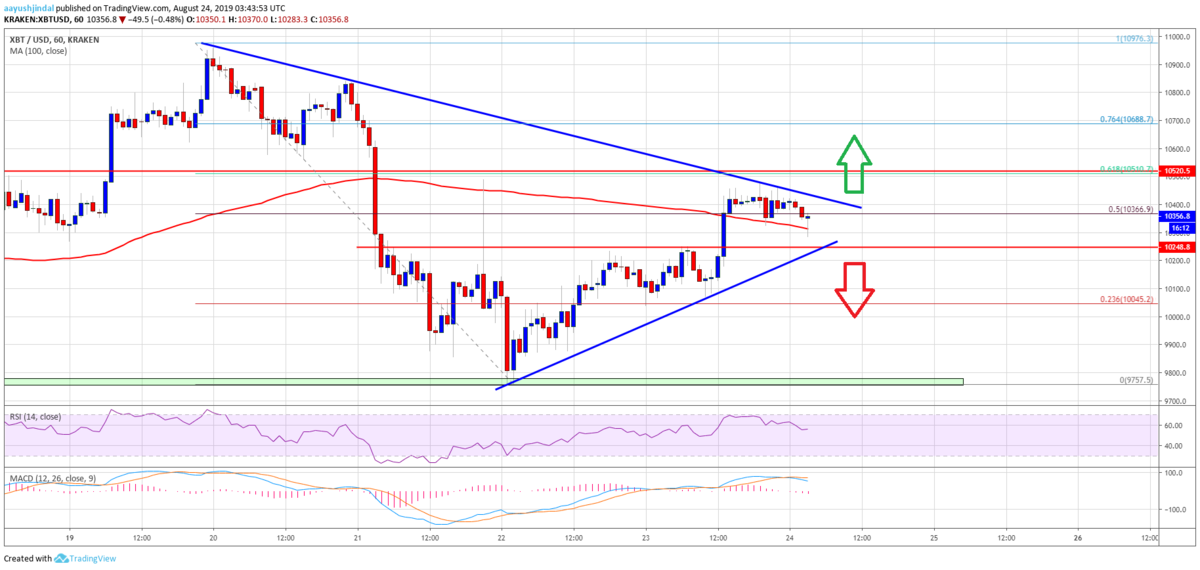
The pair is now consolidating below the trend line and the $10,500 resistance. Moreover, the 61.8% Fib retracement level of the key decline from the $10,975 swing high to $9,757 low is at $10,510.
BTC/USDペアは現在、トレンドラインと10,500ドルのレジスタンス以下で保ち合っています。また、10,975ドルから9,757ドルまでの下落の61.8% Fibリトレースメントレベルが10,510ドル付近にあります。

Therefore, the price could rally if it breaks the trend line and the $10,500 resistance area. The next stop for the bulls could be near the $11,000 resistance area in the near term. On the other hand, an immediate key support is near the $10,250 level. If there is a downside break below the $10,250 support, the price could start a fresh decline in the coming sessions.
そのため、価格がトレンドラインと10,500ドルのレジスタンスを突破すれば、再び上昇する可能性があります。短期的に強気派が次に目指すのは11,000ドルのレジスタンス付近になるでしょう。一方、直近の重要なサポートは10,250ドル付近にあります。10,250ドルのサポートを下抜ければ、今後は新たな下落を始める可能性があります。
Looking at the chart, bitcoin price is clearly setting up for the next key break either above $10,500 or below $10,250. There are high chances of a fresh bearish wave as long as the price is below the $10,500 pivot area.
チャートを見ると、ビットコインの価格は明らかに10,500ドルを超えるか10,250ドルを下抜けるかのいずれかに備えています。価格が10,500ドルのピボットエリアを下回っている限り、再び下落に転じる可能性が高いでしょう。
via: Bitcoin (BTC) Price Testing Last Line Of Defense With Positive Bias
_


