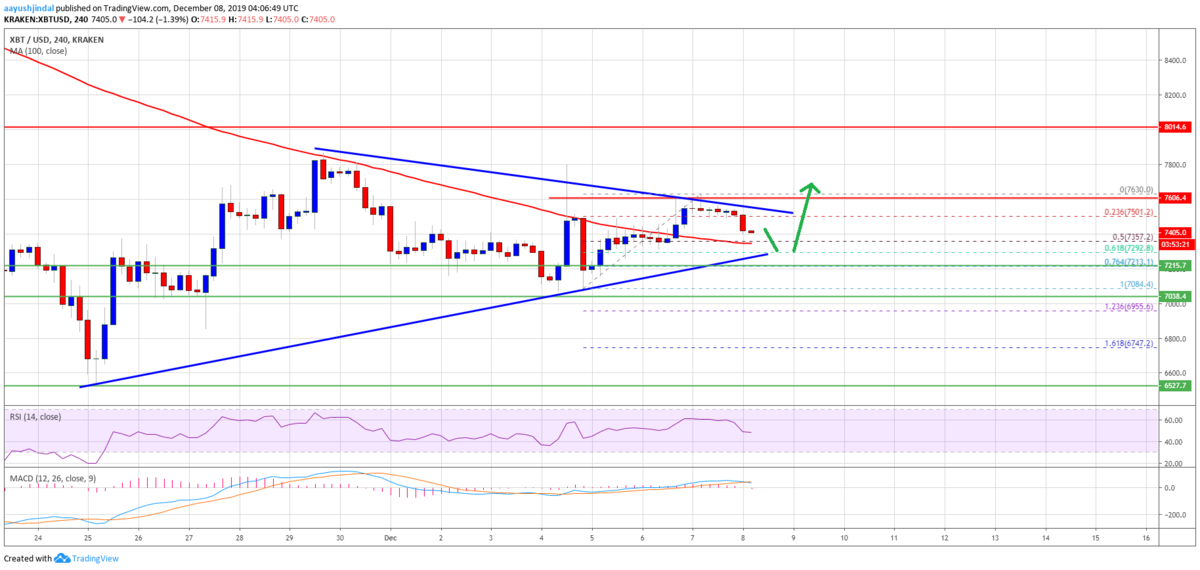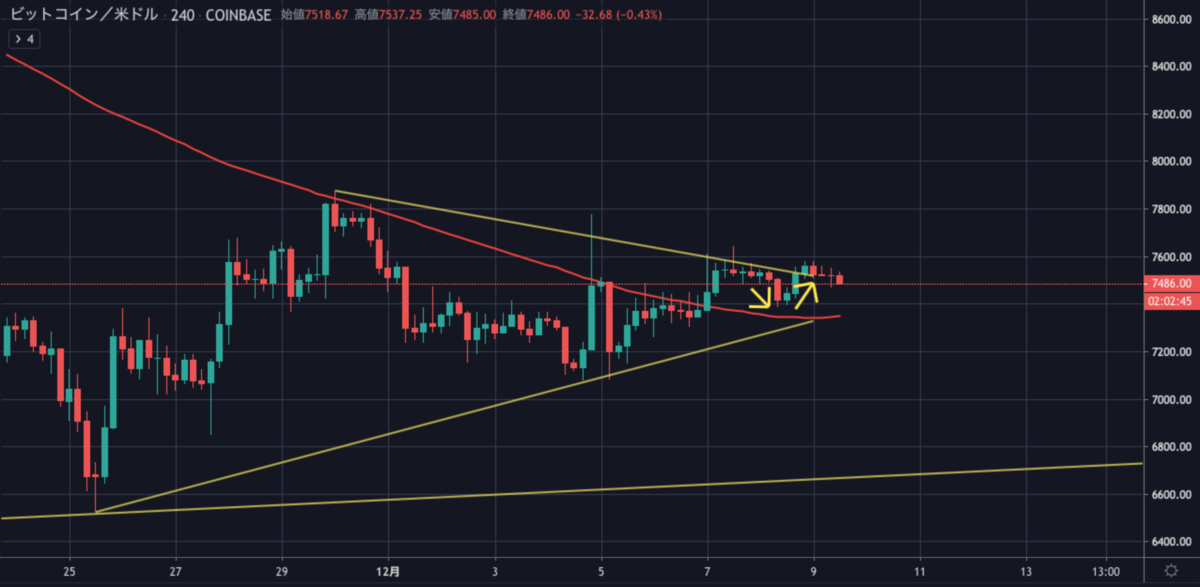
ビットコインは引き続き三角保ち合いを形成しており、小さな値幅で推移しています。
間もなくどちらかにブレイクする可能性があるため目が離せません。

Bitcoin Weekly Forecast: BTC Won’t Go Quietly, Risk of Bounce Grows

今後の値動きはどのように予想されるのでしょうか。
NEWS BTCでビットコインのチャート分析を見てみます。
ビットコインのチャート分析
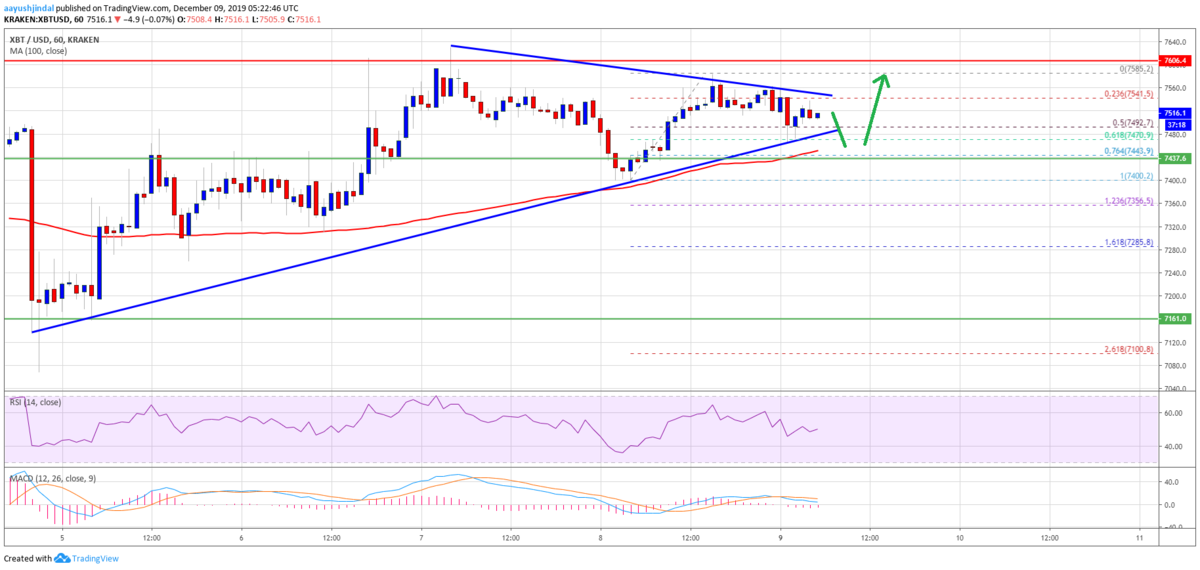
The next major support is near the $7,440 level and the 100 hourly simple moving average. Any further losses will most likely lead the price towards the $7,355 level.
次の強いサポートは7,440ドルと100時間SMA(単純移動平均線)付近になります。sらに下落すると、価格は7,355ドルレベルに向かう可能性が高くなります。

On the upside, there are a few important resistances near $7,580 and $7,600. A successful close above $7,600 and a follow through above $7,700 is likely to start a strong rally towards the $8,000 resistance zone.
上昇する場合、7,580ドルと7,600ドル付近にいくつかのレジスタンスがあります。7,600ドル以上で引け、7,700ドルを突破すると、8,000ドルのレジスタンスに向けた強い上昇が始まる可能性が高くなります。
Looking at the chart, bitcoin price is clearly showing a lot of positive signs above the $7,400 and $7,440 support levels. In the coming days, there are chances of a decent and steady rise towards the $8,000 level as long as there is no close below $7,160.
チャートを見ると、ビットコインの価格は明らかに7,400ドルと7,440ドルのサポートレベル以上で多くのポジティブサインを示しています。今後数日のうちに、7,160ドル以下で引けない限り、8,000ドルレベルに向けてしっかりと着実に上昇する可能性があります。
via: Bitcoin (BTC) Target Fresh Monthly High or Even $8K
_


