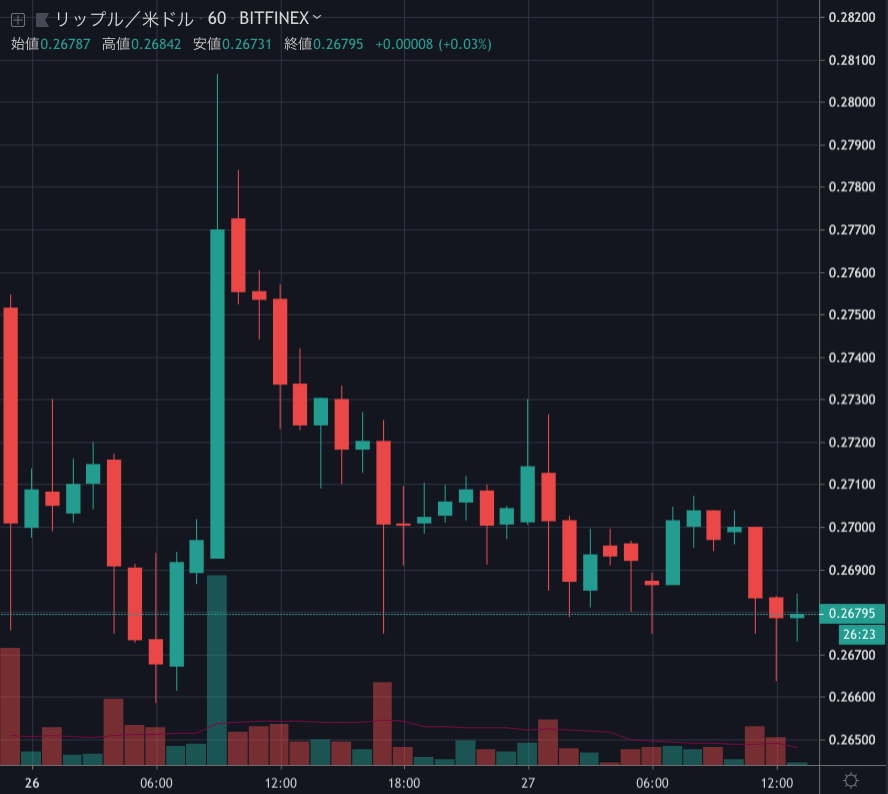
昨日はビットコインが午前9時頃に急騰し、XRPもそれに連動して急騰しました。しかし、その後何もなかったように価格を戻しています。

レジスタンスを突破する勢いはもうなくなったのでしょうか。NEWS BTCでXRPのチャート分析を見てみます。
リップル(XRP)のチャート分析
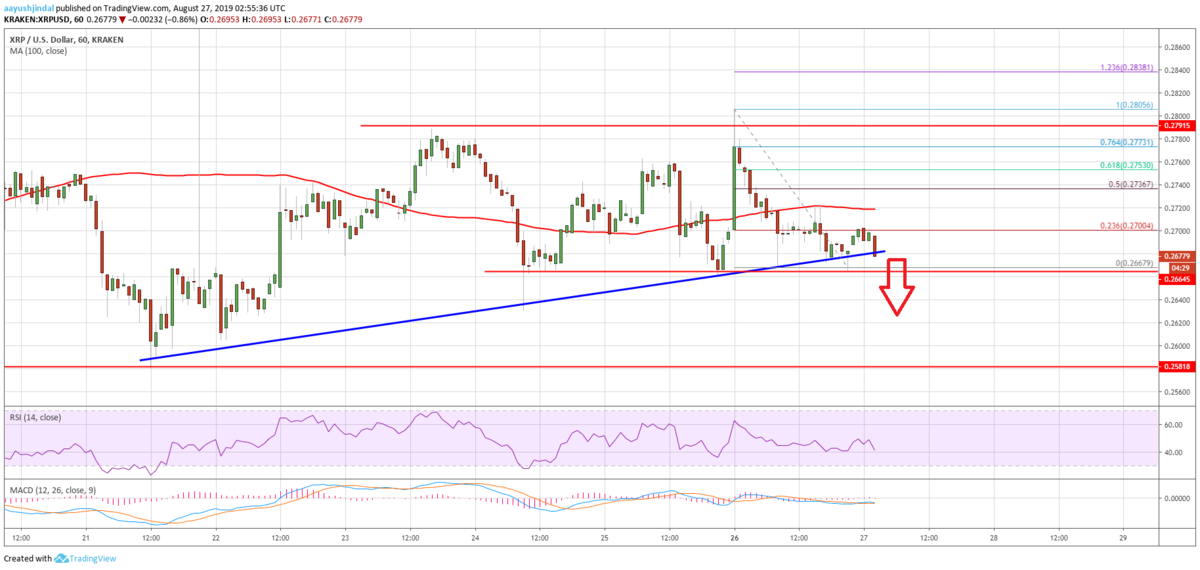
On the upside, an immediate resistance for ripple is near the $0.2700 level plus the 23.6% Fib retracement level of the recent decline from the $0.2805 high to $0.2667 low. The next key resistance is near the $0.2720 level since it coincides with the 100 hourly simple moving average. Moreover, the 50% Fib retracement level of the recent decline from the $0.2805 high to $0.2667 low is near $0.2735.
上昇する場合は、直近のレジスタンスが0.27ドル付近と最近の下落(0.2805ドル〜0.2667ドル)の23.6% Fibリトレースメントレベル付近にあります。次の重要なレジスタンスは0.272ドル付近になります。これは100時間SMA(単純移動平均線)と一致するためです。また、最近の下落(0.2805ドル〜0.2667ドル)の50% Fibリトレースメントレベルが0.2735ドル付近にあります。

Therefore, there are a few key hurdles near the $0.2720 and $0.2740 levels. The next major resistance is near the $0.2800 level, above which the price could revisit the main $0.2900 resistance area. Conversely, if the price continues to weaken, it may even trade below the $0.2580 support.
そのため、0.272ドルと0.274ドル付近にいくつかの重要なハードルがあります。次の大きなレジスタンスは0.28ドル付近。これを上回れば主なレジスタンスである0.29ドルを再び試す可能性があります。逆に、下落を続ける場合は0.258ドルのサポートを下抜けるかもしれません。
Looking at the chart, ripple price is slowly moving into a bearish zone and it may soon break the trend line and $0.2650. In the mentioned bearish case, there are high chances of a downside break below the $0.2580 support.
チャートを見ると、リップルの価格はゆっくりと弱気ゾーンに入り、間もなくトレンドラインと0.265ドルを下抜ける可能性があります。その場合、0.258ドルのサポート以下まで下落する可能性が高くなります。
via: Ripple Price (XRP) At Risk Of Downside Break, Eyes $0.2500
_


