関東から近畿地方にかけて梅雨入りが発表されました。ビットコインのチャート分析を見てみます。
仮想通貨の英語記事シリーズ、今回はこの記事を読んでいきます。
Markets Update: Leading Cryptocurrencies Break Above Bear Channels
ビットコインのチャート分析
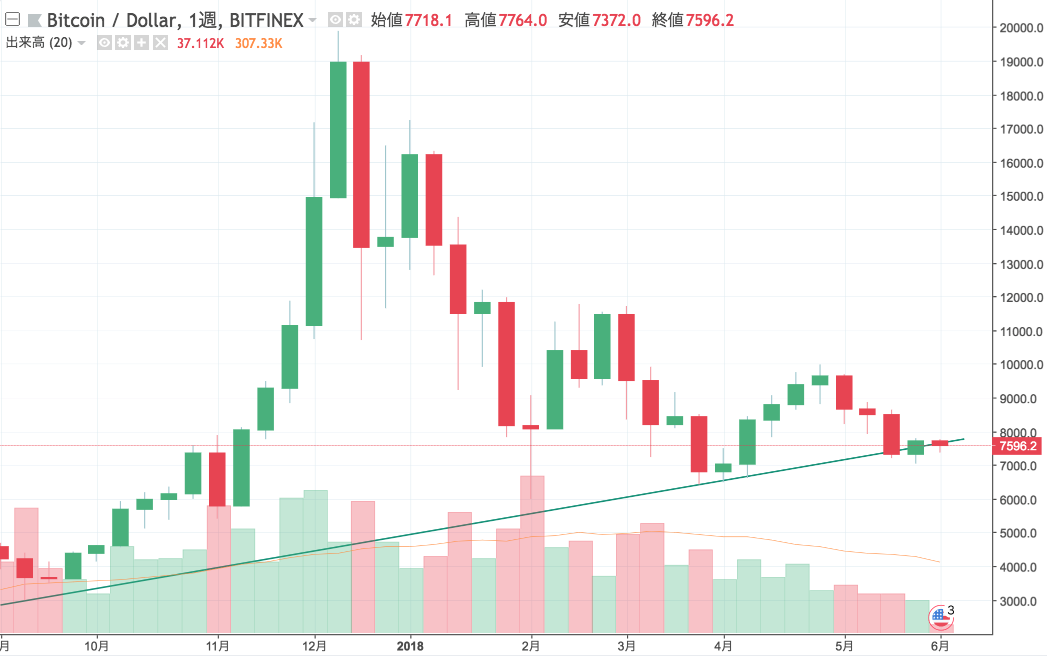
The BTC markets recently posted a green weekly candle for the first time in the last four weeks – signaling for the potential for bitcoin to produce a second consecutive higher low since February’s washout down to $6,000 USD.
BTC 市場では週足に 4 週間ぶりの陽線が現れました。これはビットコインが 6,000 ドルまで暴落した 2 月から 2 回目となる安値切り上げの可能性を示しています。

Should support at approximately $7,000 successfully hold, many traders predicting that more bullish momentum may be in store the BTC markets. Transversely, a break-down from the current price area to retest $6,000 would also comprise the rejection of the long-term ascending trendline dated from July 2017.
7,000 ドル付近のサポートを首尾良く維持することができれば、多くのトレーダーは BTC 市場がより強気になると予想するでしょう。逆に、現在の価格帯から下方にブレイクして 6,000 ドルを再び試すと、2017 年 7 月からの長期的な上昇トレンドラインを拒否する可能性もあります。
Should this trendline break, such would likely comprise the catalyst for further bearish price action across the cryptocurrency markets.
このトレンドラインを下抜けると、仮想通貨市場全体のさらなる下落に繋がる可能性があります。
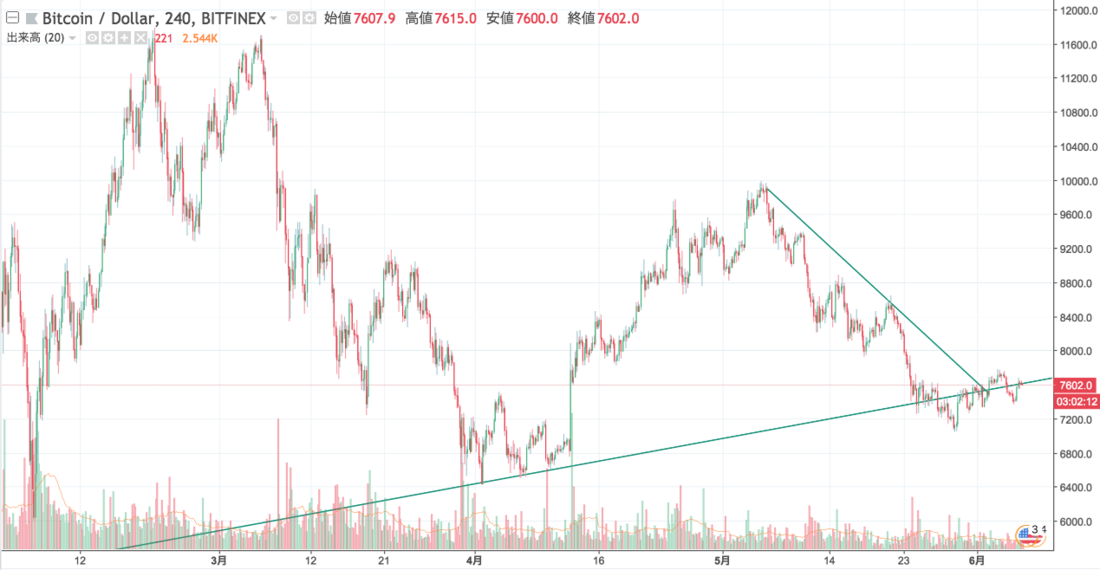
Looking at BTC on the 4-hour chart, one can see that it has broken above the immediate descending bear-channel in which the markets have trended for several weeks, as with many other cryptocurrency markets. If BTC can stay outside of said channel, such may be a signal for coming upward price action.
4 時間足チャートで BTC を見ると、他の多くの仮想通貨同様に、市場で数週間続いた下降チャネルを上方にブレイクしたことがわかります。BTC がこのチャネルの外側に留まることができれば、今後の価格上昇シグナルになり得ます。

_


