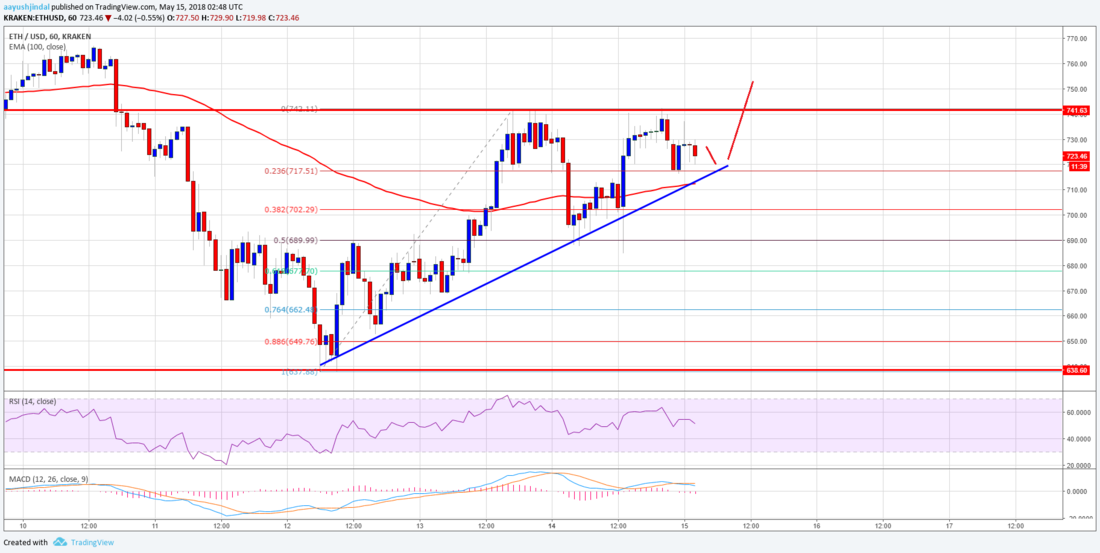
コンセンサス 2018 が始まり、各通貨の価格がじわじわと上昇しています。イーサリアムは大きく上昇した後、調整で少し下げています。イーサリアムのチャート分析を見てみます。
仮想通貨の英語記事シリーズ、今回はこの記事を読んでいきます。
Ethereum Price Analysis: ETH/USD Could Extend Gains
イーサリアムのチャート分析
At the moment, the price is correcting lower and is trading near the $720 level. An initial support on the downside sits around the 23.6% Fib retracement level of the last leg from the $637 low to $743 high. However, the most important support is near $715, which is close to yesterday’s highlighted key bullish trend line on the hourly chart of ETH/USD. Moreover, the 100 hourly simple moving average is also positioned around the trend line support near $710.
現在、価格は調整中で 720 ドル水準付近で取引されています。下側の最初のサポートは、直近の足 (637 ドルの安値から 743 ドルの高値まで) の 23.6% フィボナッチリトレースメント水準になります。しかし、最も重要なサポートは、ETH/USD の 1 時間足チャートで昨日の焦点となった上昇トレンドラインの 715 ドル付近にあります。さらに、100 時間単純移動平均線もトレンドラインサポートに近い 710 ドル付近に位置しています。

Therefore, the $710-715 zone is a decent buy area and it is likely to prevent declines. Below $710, the next major support is around the 50% Fib retracement level of the last leg from the $637 low to $743 high at $689.
そのため、710〜715 ドルゾーンは相当な買いエリアとなり、ここで下降が防がれそうです。710 ドル以下での次の重要なサポートは、直近の足 (637 ドルの安値から 743 ドルの高値まで) の 50% フィボナッチリトレースメント水準となる 689 ドルになります。
Looking at the chart, the price remains well supported above $700. It may trade in a range for a few more hours above $700 before making the next move. There are high chances of it breaking $743 as long as ETH is above the 100 hourly SMA.
チャートを見ると、価格は 700 ドル以上でしっかりとサポートされたままです。次の動きがあるまで、さらに数時間は 700 ドル以上のレンジ内で取引されそうです。ETH が 100 時間単純移動平均線より高い価格で取引されている限り、743 ドルを突破する可能性は高いと思われます。
_


