どうもワイです。
4 月に入って仮想通貨の価格が下げ止まった感があります。久しぶりにイーサリアムのチャート分析を見てみましょう。
仮想通貨の英語記事シリーズ、今回はこの記事を読んでいきます。
Ethereum Price Technical Analysis – Can ETH/USD Recover Again?
イーサリアムのチャート分析
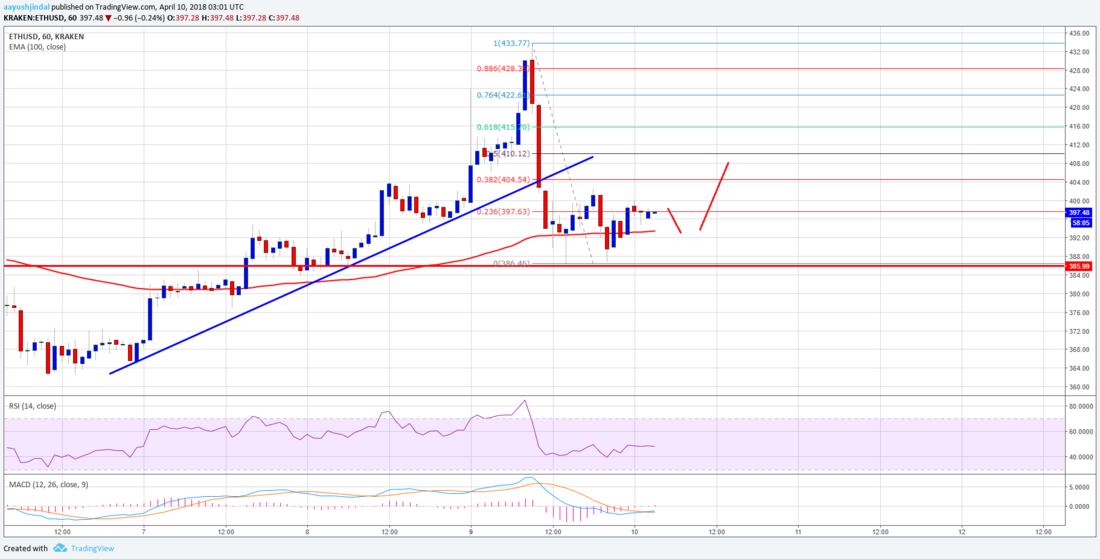
Yesterday, there was a decent upside move above the $400 level in ETH price against the US Dollar. The price even traded above the $430 level, but it could not gain momentum. A high was formed at $433.77 from where the price started a downside move. It declined and moved below the 50% Fib retracement level of the last wave from the $383 low to $433 high.
昨日 ETH はかなり上昇し、USD に対して 400 ドル水準を上回りました。また、430 ドル水準以上での取引もありましたが、勢いを増すことはできませんでした。価格は 433.77 ドルで高値を付けたものの下落を始め、383 ドルの安値から 433 ドルの高値 で作られる直近の波の 50% フィボナッチリトレースメントを下回りました。

Moreover, yesterday’s highlighted major bullish trend line with support at $404 was broken on the hourly chart of ETH/USD. It opened the doors for more losses and the price almost tested the $385 level. A low was formed at $386.46 before buyers appeared.
さらに、昨日の 404 ドルでサポートされる強い上昇トレンドラインは、ETH/USD の時間足チャートでブレイクされました。これによりさらなる下落の可能性が生まれ、価格は 385 ドル水準を試す展開になりそうです。買い手が現れるまでに 386.46 ドルで安値を付けました。
At the moment, the price is recovering, and trading above $390 and the 100 hourly simple moving average. It has to break the 23.6% Fib retracement level of the last decline from the $433 high to $386 low to gain further. Once there is a proper break and close above $400, the price might trade above the $415 level in the near term.
On the flip side, if there is a break below the $386 low, the price could decline further. On the downside, the next major support below $386 is at $370.
現在、価格は回復しており、390 ドルと 100 時間単純移動平均線を上回る水準で取引されています。上昇するためには、433 ドルの高値から 386 ドルの安値で作られる直近の下落の 23.6% フィボナッチリトレースメントレベルをブレイクしなければなりません。これを確実にブレイクして 400 ドル以上の終値で引けることができれば、近いうちに価格が 415 ドル水準を上回る可能性があります。
逆に 386 ドルの安値を下抜けることがあれば、価格がさらに下落する可能性があります。下側では、386 ドル以下での次の重要なサポートは 370 ドルになります。
逆に 386 ドルの安値を下抜けることがあれば、価格がさらに下落する可能性があります。下側では、386 ドル以下での次の重要なサポートは 370 ドルになります。
今回はイーサリアムのチャート分析でした。
イーサリアムも何だかんだでビットコイン価格に連動しているので、ビットコインが上昇に転じれば一緒に上がっていくでしょうね (適当)。
_


