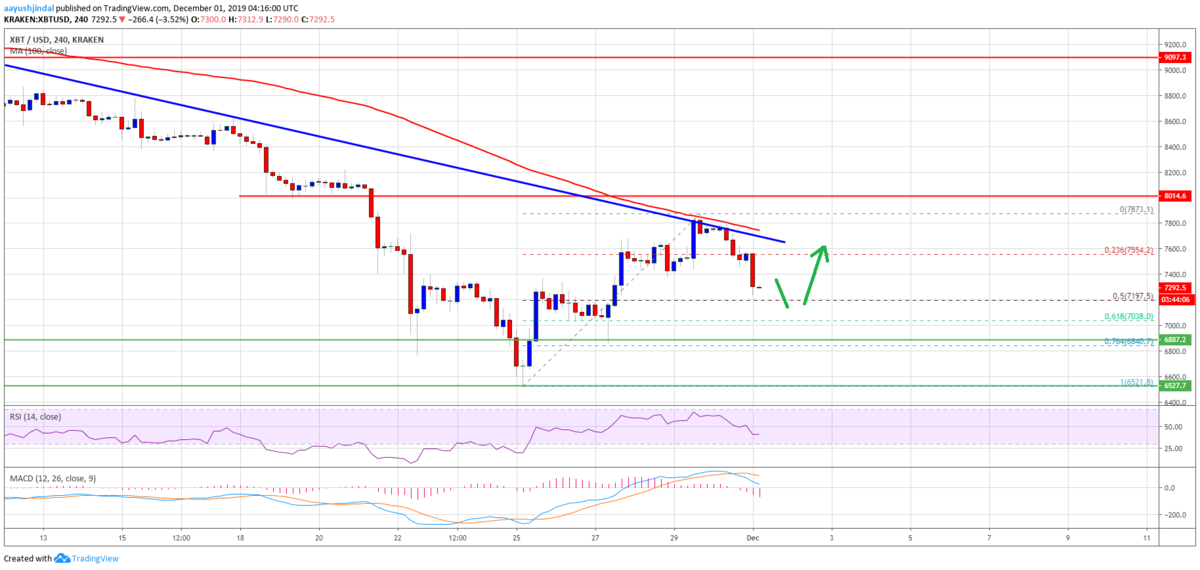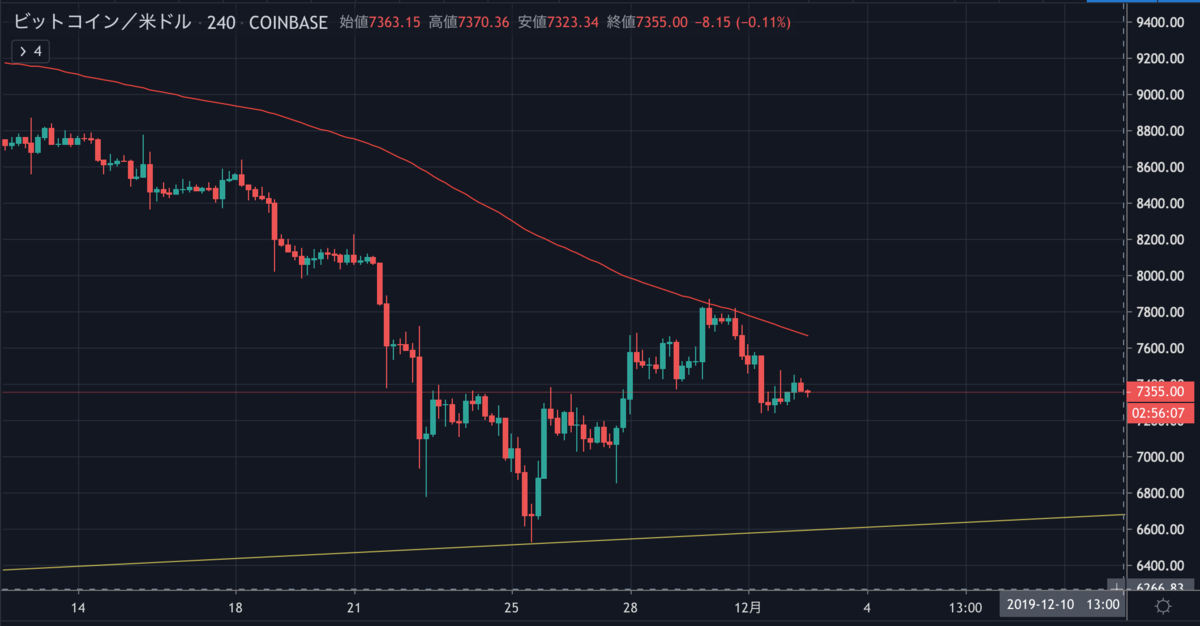
昨日のビットコインは7,200ドル付近まで下落した後、少し回復して現在は7,300ドル付近で取引されています。

Bitcoin Weekly Forecast: BTC Eyeing Last Line Of Defense

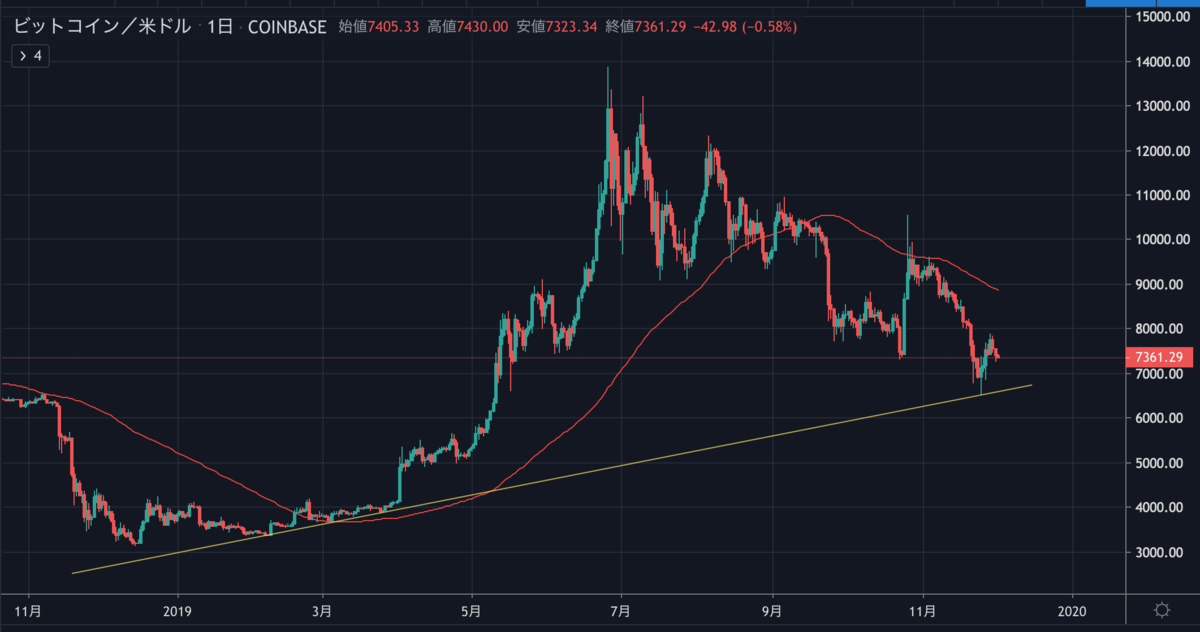
日足チャートを見るとサポートラインまで戻ってもおかしくなさそうに見えますが、どうでしょうか。

NEWS BTCでビットコインのチャート分析を見てみます。
ビットコインのチャート分析
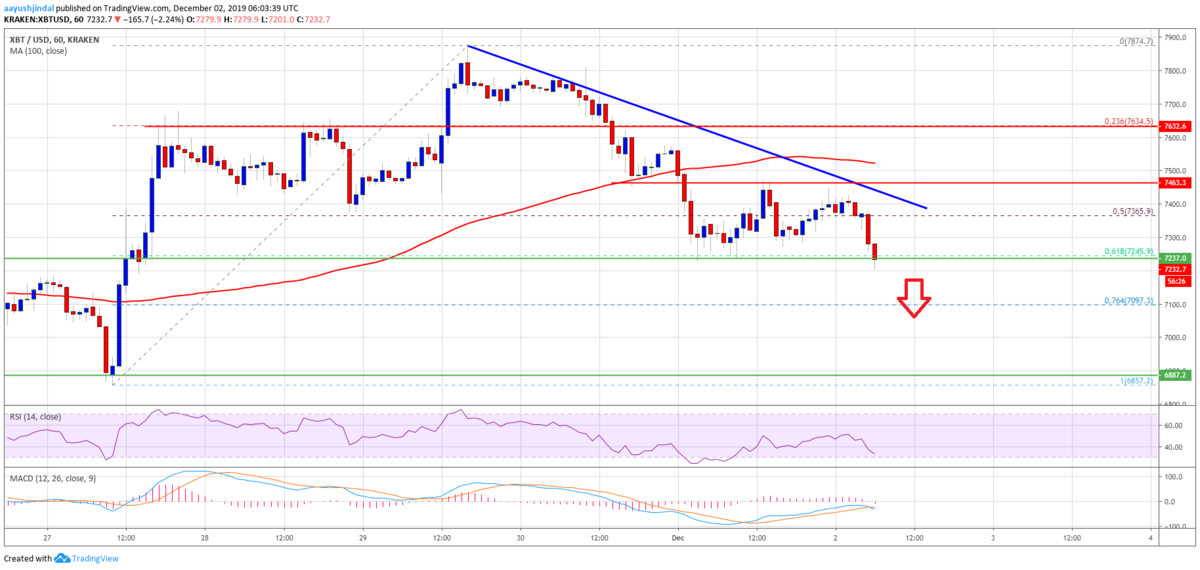
If there is a downside break below the $7,200 support area, the price could revisit the $7,000 support area. Additionally, an intermediate support is near the 76.4% Fib retracement level of the upward wave from the $6,857 swing low to $7,874 high.
7,200ドルのサポートエリアを下抜ける場合、価格は7,000ドルのサポートエリアに戻る可能性があります。さらに、中間サポートは上昇の波(6,857ドル〜7,874ドル)の76.4% Fibリトレースメントレベル付近になります。

The bears are gaining momentum and if the price clears the $7,000 support, there is a risk of a sharp decline. In the mentioned scenario, the price may perhaps revisit the $6,500 support area in the near term.
下落は勢いを増しており、7,000ドルのサポートを下抜けると急落する恐れがあります。その場合、短期的に6,500ドルのサポートエリアを再び試すかもしれません。
On the upside, there is a key resistance forming near the $7,400 level. Besides, there is a major bearish trend line forming with resistance near $7,390 on the hourly chart of the BTC/USD pair.
上昇する場合は、7,400ドル付近に重要なレジスタンスが形成されています。また、BTC/USDペアの時間足チャートには、7,390ドル付近でレジスタンスとなる強い下降トレンドラインが形成されています。
Therefore, a clear break above the $7,400 resistance is needed for a fresh increase. Furthermore, the next immediate resistance is near the $7,500 level and the 100 hourly simple moving average.
そのため、新たに上昇を始めるには7,400ドルのレジスタンスをはっきりと突破する必要があります。さらに、次のレジスタンスは7,500ドルと100時間単純移動平均線付近になります。
via: Bitcoin (BTC) Signaling Bearish Continuation, $7K Support At Risk
_


