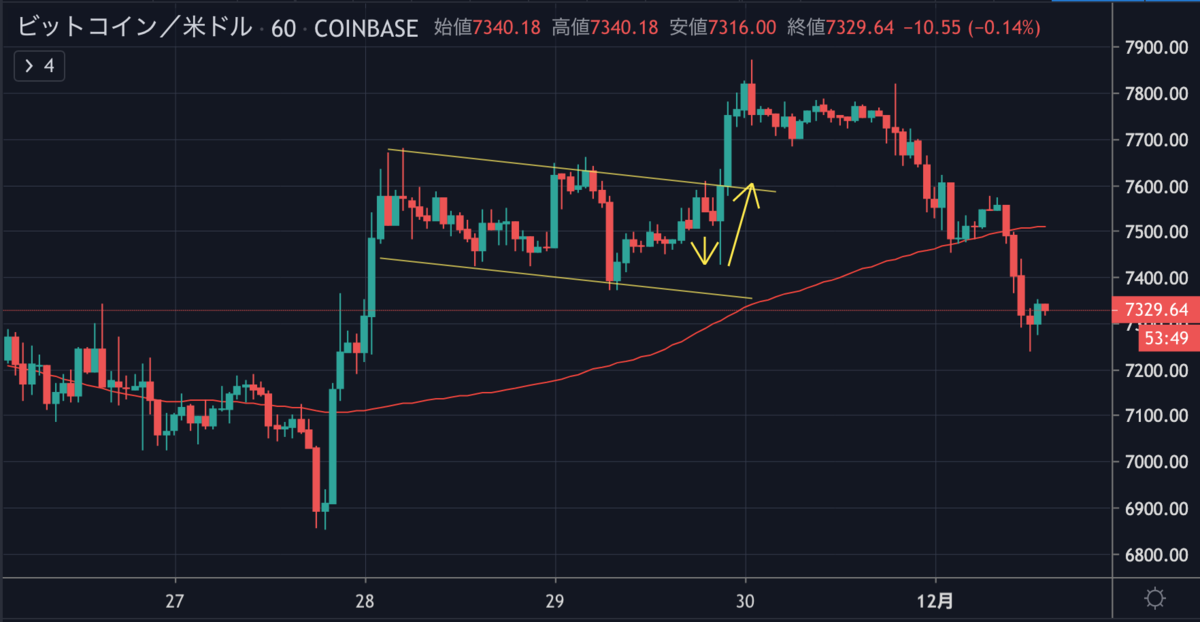
しばらく続いていた下落がおさまったように見えたビットコインは、逆三尊を形成して反発したものの、昨夜から再び下落して現在は7,300ドル付近で取引されています。

Bitcoin (BTC) Resilience Pauses But Not Out of Woods Yet

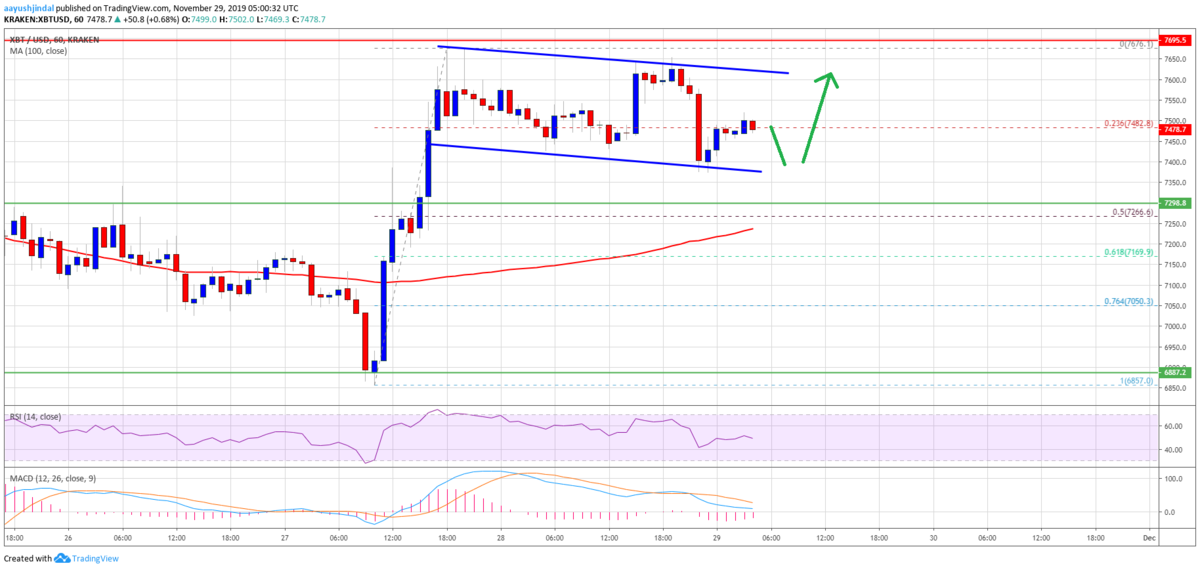
週末の値動きについては、前回のNEWS BTCの予想図に近い動きで上昇したものの、元の価格帯まで下落しています。
今後の値動きはどのように予想されるのでしょうか。
NEWS BTCでビットコインのチャート分析(週間予想)を見てみます。
ビットコインのチャート分析
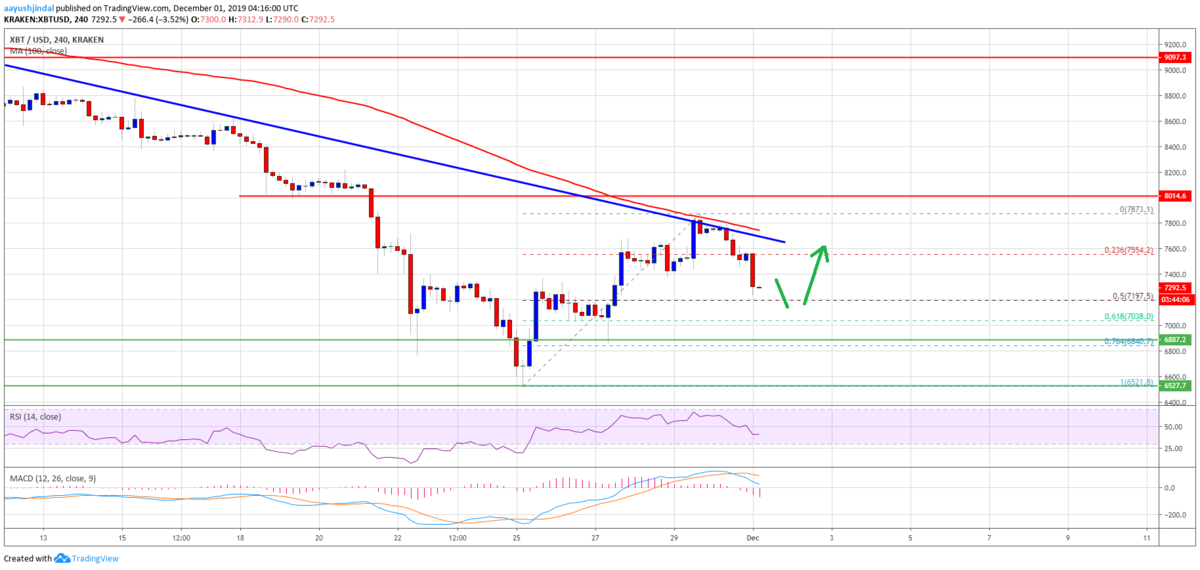
On the downside, an immediate support is near the $7,200 level.
下落する場合の直近のサポートは7,200ドル付近になります。

If there are more downsides, the price could test the main $7,000 support area in the near term.
さらに下落すると、近いうちに7,000ドルのメインサポートエリアを試す可能性があります。
Therefore, a daily close below the main $7,000 support could start a fresh bearish wave. In the mentioned case, the price is likely to break the $6,500 support in the near term.
そのため、日足が7,000ドルのメインサポート以下で引けると、新たな弱気の波が始まる可能性があります。その場合、近いうちに6,500ドルのサポートを下抜ける可能性が高いでしょう。
On the upside, the price is facing a lot of hurdles near the $7,700 and $7,800 levels. However, the price must settle above the $8,000 resistance area, the trend line, and the 100 simple moving average (4-hours) to start a strong rise in the coming weeks.
上昇する場合は、7,700ドルと7,800ドル付近に多くのハードルがあります。しかし、今後数週間で大幅な上昇を始めるには、8,000ドルのレジスタンスエリア、トレンドライン、100期間単純移動平均線(4時間足)以上で安定する必要があります。
via: Bitcoin Weekly Forecast: BTC Eyeing Last Line Of Defense
_


