しばらく下落を続けていたビットコインが反発し、一時は7,600ドルを突破しました。現在は7,500ドル付近で取引されています。
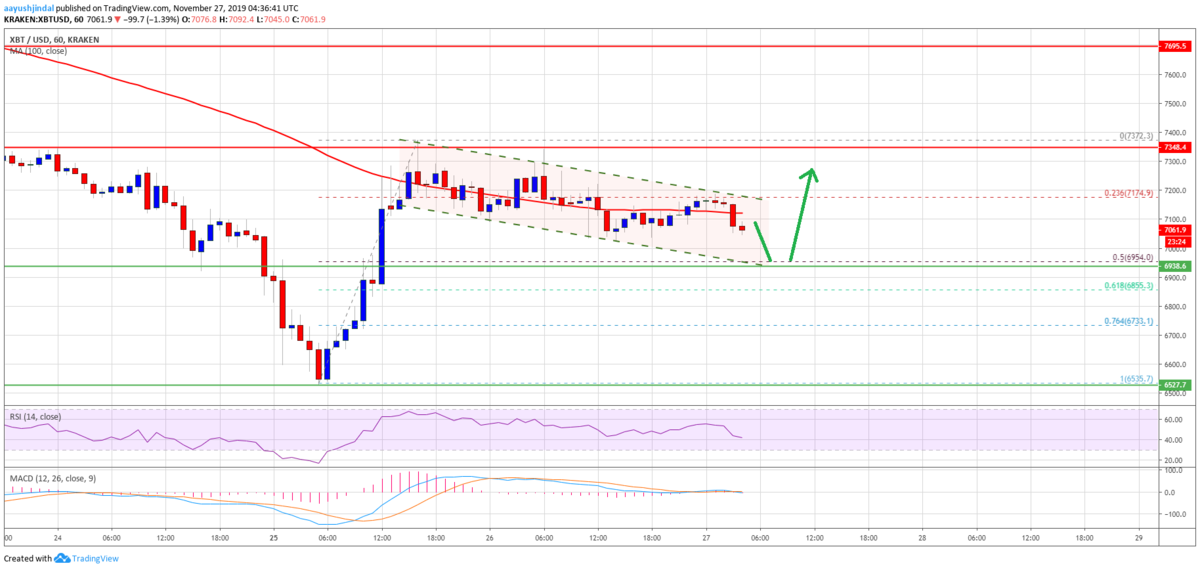
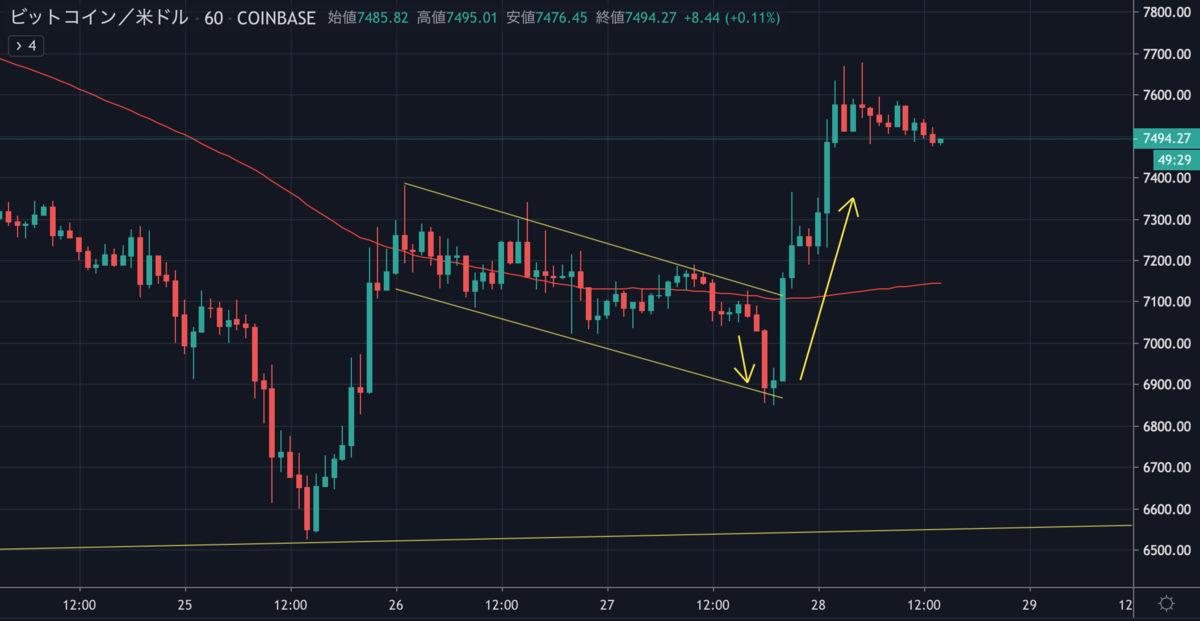
昨日のNEWS BTC先生の予想図は完全に的中していました。

Bitcoin (BTC) Hesitates But Further Recovery Above $7.2K Seem Likely

先生はたまにすごい当て方をするから目が離せない。
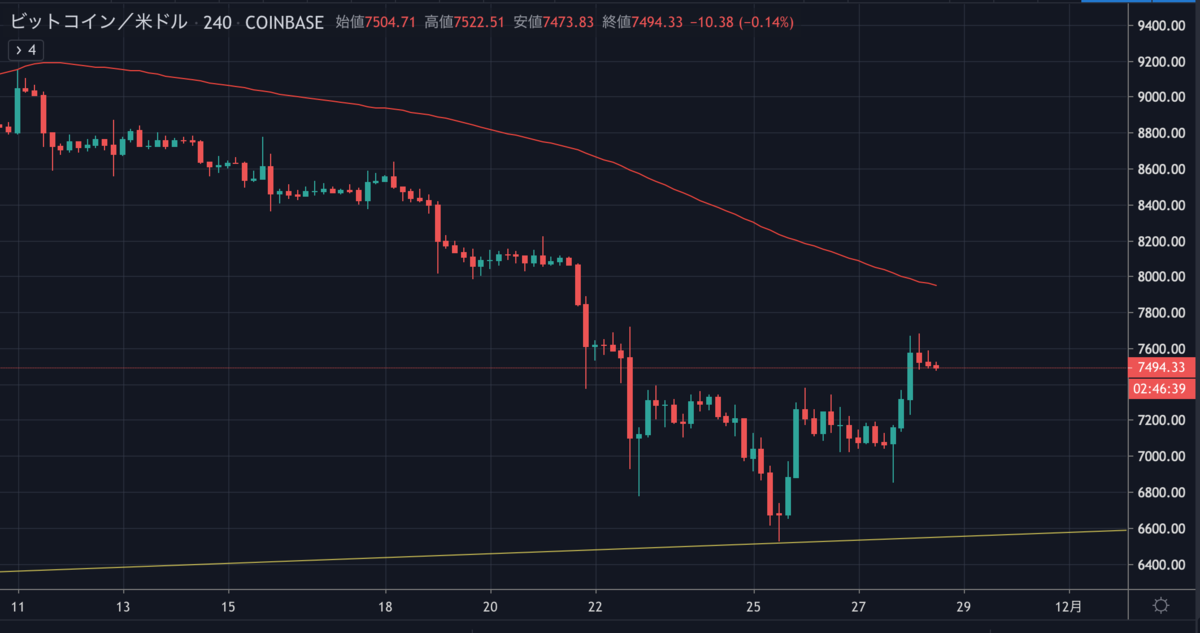
また、4時間足チャートを見ると逆三尊のパターンを形成しているように見えます。

今後の値動きはどのように予想されるのでしょうか。
NEWS BTCでビットコインのチャート分析を見てみます。
ビットコインのチャート分析
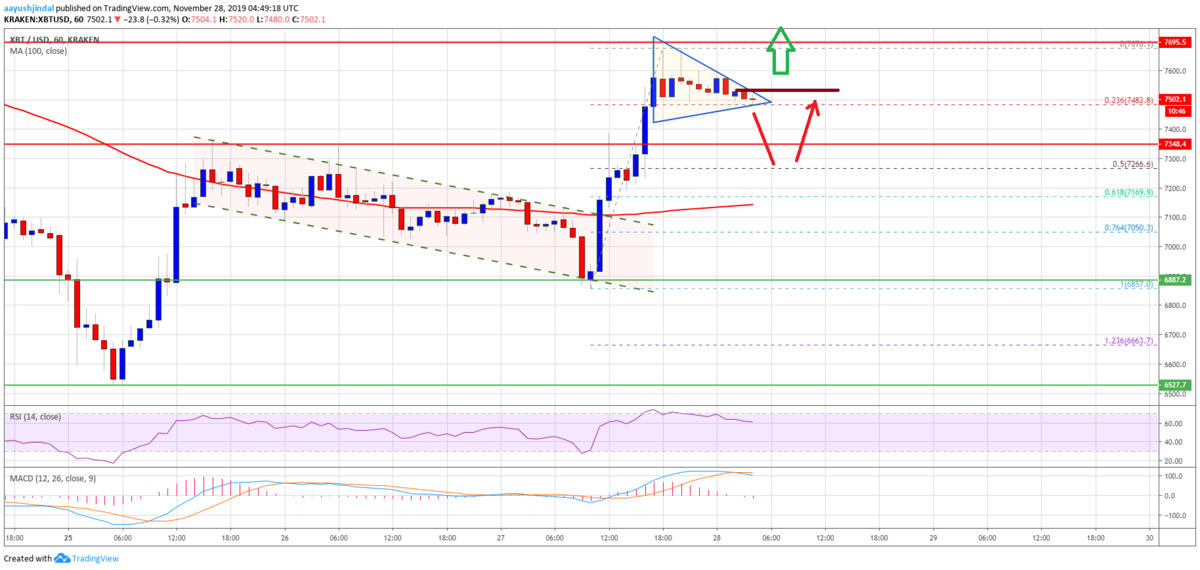
Bitcoin price even rallied above the $7,500 resistance and traded close to the next key resistance near $7,700 (as pointed out in the weekly forecast).
ビットコインの価格は7,500ドルのレジスタンスを突破し、(週間予想で指摘したように)次の重要なレジスタンスである7,700ドル付近で取引されました。

It broke the $7,600 level, but holding the 23.6% Fib retracement level of the recent upward move from the $6,857 low to $7,676 high. Additionally, there is a short term contracting triangle forming with resistance near $7,540 on the same chart.
7,600ドルの水準は下抜けたものの、最近の上昇(6,857ドル〜7,676ドル)の23.6% Fibリトレースメントレベルは維持しています。さらに、同じチャート上に、7,540ドル付近でレジスタンスとなる短期的な三角保ち合いが形成されています。
Therefore, there are two possible scenarios – first, the price resumes its rise above the $7,600 and $7,700 resistance level. In the mentioned case, the bulls are likely to aim the $8,000 resistance.
そのため、次の2つのシナリオが考えられます。まず、7,600ドルと7,700ドルのレジスタンスレベルを突破して上昇を再開する。この場合、買い方は8,000ドルのレジスタンスを狙う可能性が高いでしょう。
Conversely, the price could correct further lower below the $7,450 support. The next support is near the $7,340 level. The main support is near the $7,260 level since it is the 50% Fib retracement level of the recent upward move from the $6,857 low to $7,676 high.
逆に、7,450ドルのサポート以下まで調整する可能性もあります。次のサポートは7,340ドル付近です。最近の上昇(6,857ドル〜7,676ドル)の50% Fibリトレースメントレベルが近くにあることから、メインサポートは7,260ドル付近になります。
via: Bitcoin (BTC) Shows Signs of Important Reversal To $8K
_


