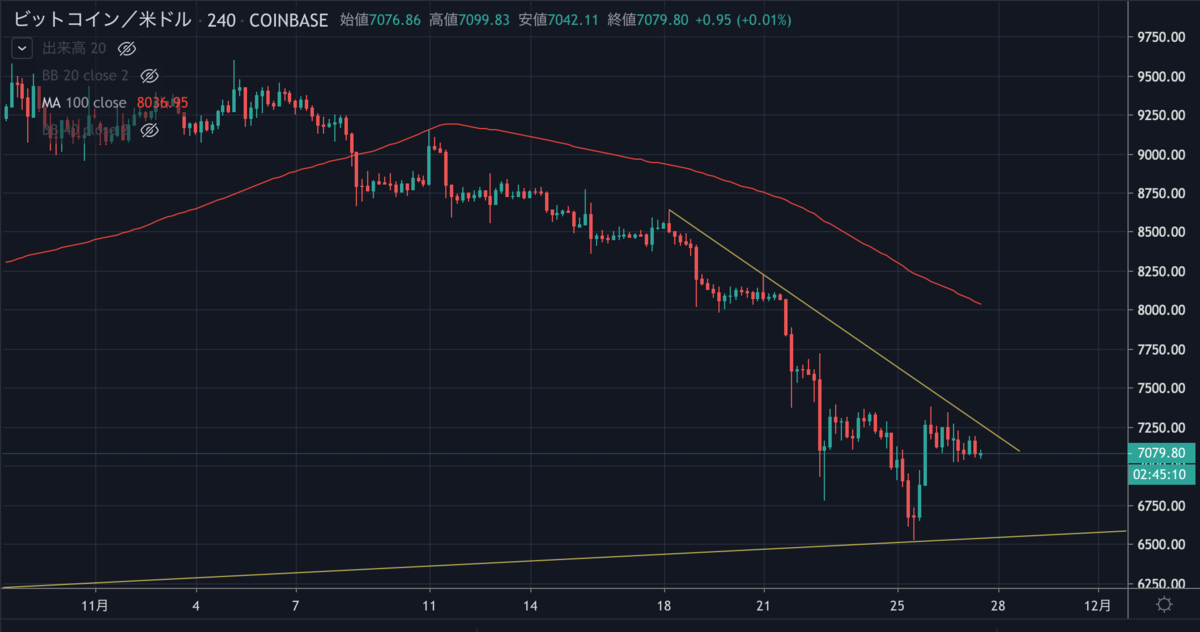
昨日のビットコインは、長期的なサポートラインで反発したものの上昇は長く続かず、現在は7,100ドル付近で取引されています。

下降トレンドラインを突破できなかったBTCは再び下落を始めるのでしょうか。
NEWS BTCでビットコインのチャート分析を見てみます。
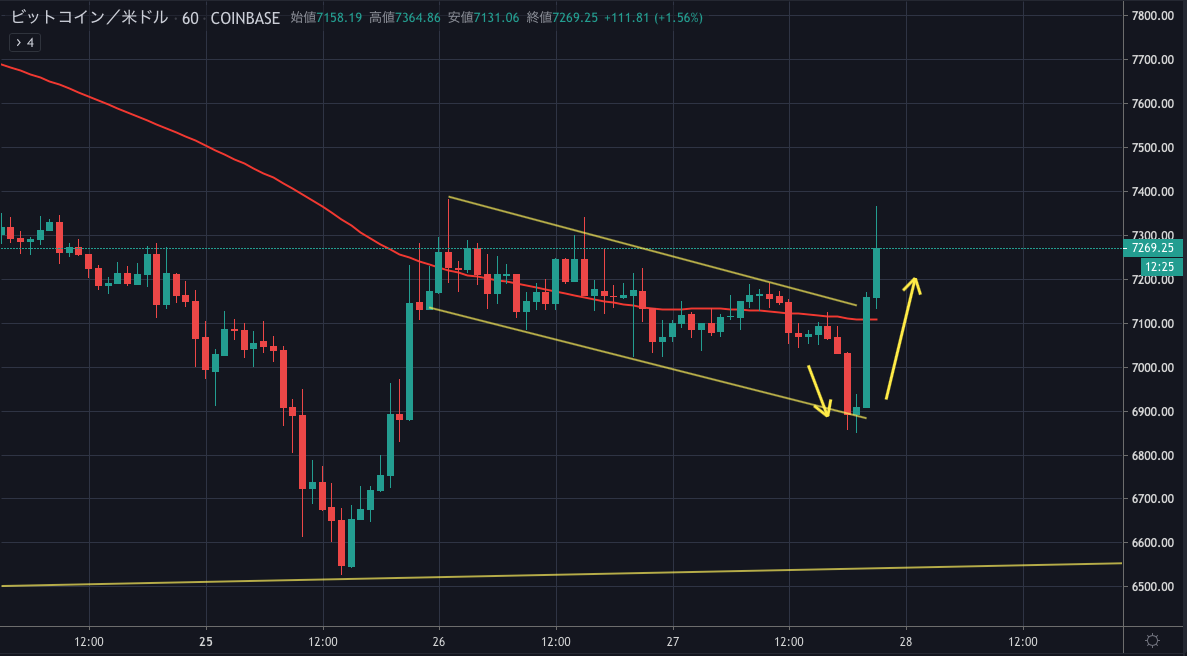
[21:50 追記]
ビットコインが上昇して7,200ドルを突破。この値動き、完全的中やないか!

ビットコインのチャート分析
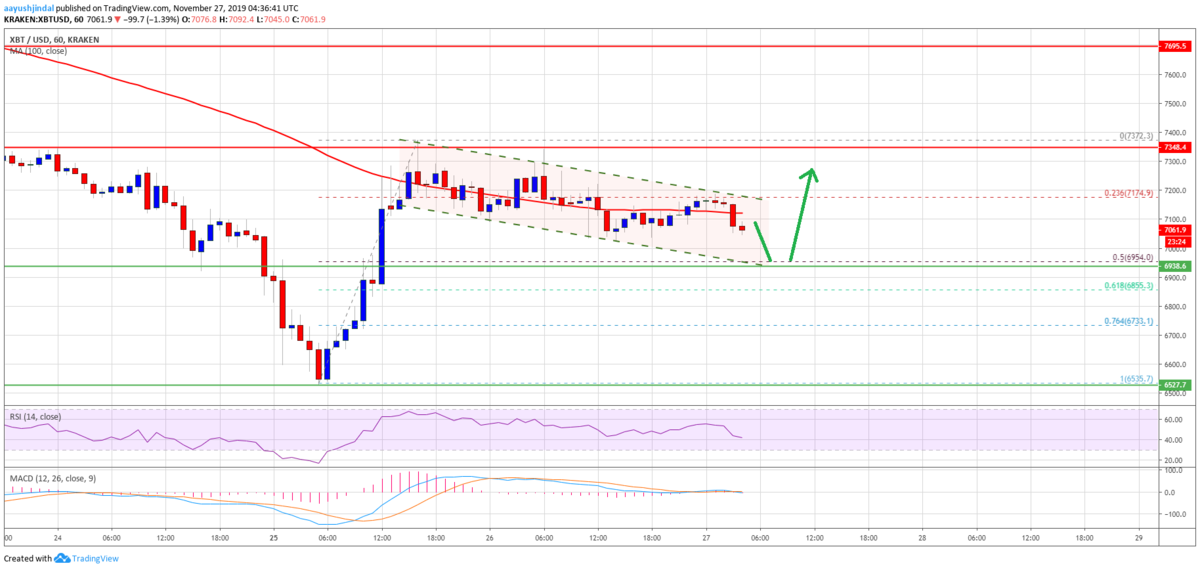
On the downside, there are a few key supports near the $7,025, $7,000 and $6,950 levels. The main support for the current wave is near $6,950 since it is near the 50% Fib retracement level of the recent rise from the $6,535 low to $7,372 high.
下落時は7,025ドル、7,000ドル、6,950ドル付近に重要なサポートがいくつかあります。最近の上昇(6,535ドル〜7,372ドル)の50% Fibリトレースメントレベルも近くにあることから、現在の波のメインサポートは6,950ドル付近になります。

If there is downside break and close below $6,950, the price is likely to resume its decline. The next supports are near the $6,660 and $6,540 levels. On the upside, an initial resistance is near the $7,150 level and the 100 hourly SMA.
下落して6,950ドル以下で引けた場合、価格は再び下落を始める可能性が高くなります。次のサポートは6,660ドルと6,540ドル付近です。上昇する場合の最初のレジスタンスは7,150ドルと100時間SMA(単純移動平均線)付近になります。
More importantly, there is likely a bullish flag forming with resistance near $7,170 on the hourly chart of the BTC/USD pair. Therefore, an upside break above $7,200 might set the pace for more upsides and recovery.
さらに重要なのは、BTC/USDペアの時間足チャートに、7,170ドル付近でレジスタンスとなる強気のフラッグが形成されそうなことです。そのため、7,200ドルを上抜けるとさらに上昇する可能性があります。
Looking at the chart, bitcoin price is holding a couple of important supports near $6,950. As long as there is no close below $6,950, there are chances of upside continuation above $7,200 and $7,400.
チャートを見ると、6,950ドル付近に重要なサポートがいくつかあります。6,950ドル以下で引けない限り、7,200ドルと7,400ドルを超えて上昇が続く可能性があります。
via: Bitcoin (BTC) Hesitates But Further Recovery Above $7.2K Seem Likely
_


