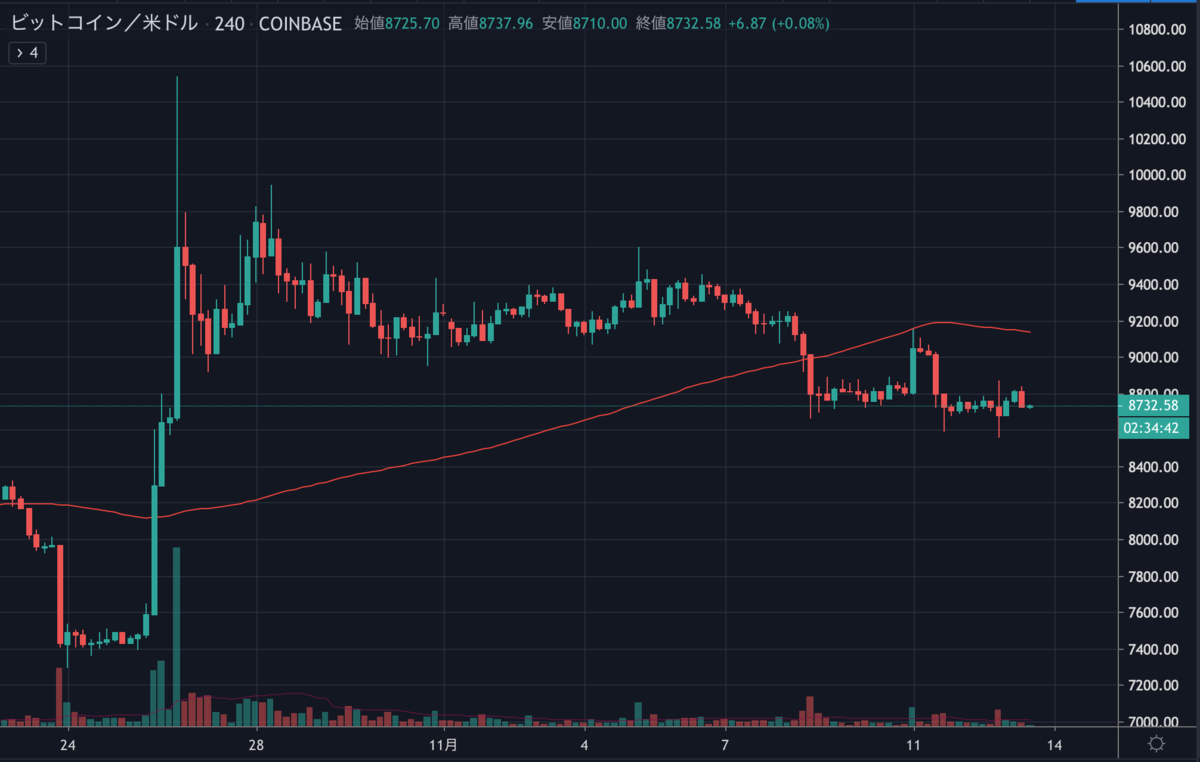
最近のビットコインは、サポートラインを下抜けしたもののそれほど急激に下落するわけでもなく、ほぼ横ばいで推移しています。
ショート勢としては今ひとつ盛り上がらない値動きですが、ロング勢にとってはそれほど痛くもなくまだ耐えられる展開でしょうか。

カクカクとした動きを続けるBTCの今後はどのように予想されるのでしょうか。
NEWS BTCでビットコインのチャート分析を見てみます。
ビットコインのチャート分析
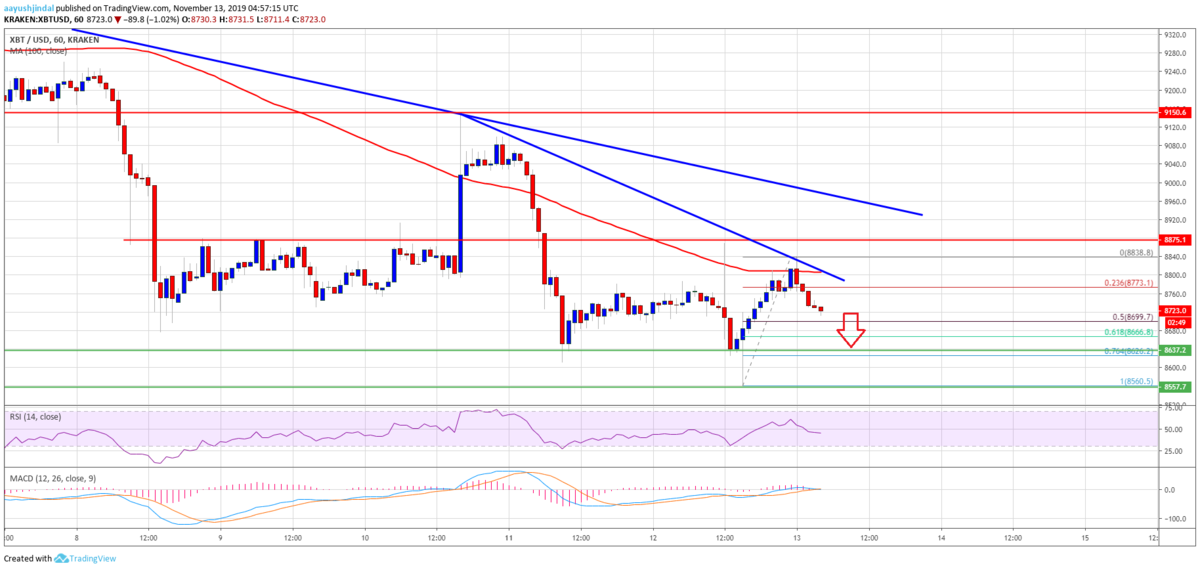
An immediate support is near the $8,700 level.
直近のサポートは8,700ドル付近です。
If there is a downside break below $8,700, there is a risk of more downsides. The next support is near the $8,560 low.
8,700ドルを下抜けると、さらに大きく下落する恐れがあります。次のサポートは8,560ドル付近になります。

On the upside, there are many resistances, starting with $8,800 and the 100 hourly SMA. More importantly, yesterday’s major bearish trend line is active with resistance near $8,920 on the hourly chart of the BTC/USD pair.
上昇する場合は、8,800ドルと100時間SMAをはじめ、多くのレジスタンスがあります。さらに重要なのは、BTC/USDペアの時間足チャートで、8,920ドル付近でレジスタンスとなる強い下降トレンドラインが機能していることです。
Looking at the chart, bitcoin is facing an increase in selling pressure below $8,800. If it fails to stay above $8,700, the bears could gain momentum for a push below the $8,600 and $8,500 levels.
チャートを見ると、ビットコインは8,800ドル以下で売り圧力が増しています。8,700ドル以上の水準を維持できなければ、下落の勢いが増し、8,600ドルと8,500ドルを下抜けるかもしれません。
via: Bitcoin (BTC) Price Eyeing Fresh Monthly Low Below $8.5K
_


